Figure 1.

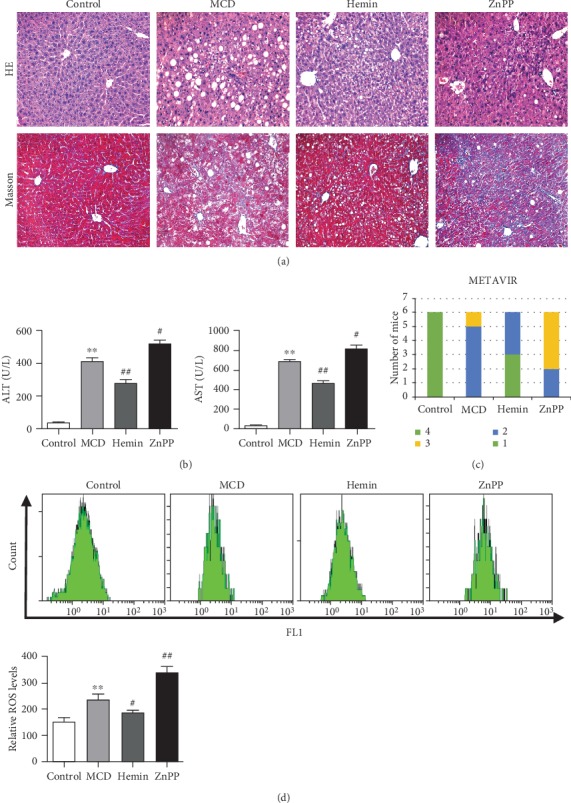
Mice fed with MCD diet developed steatohepatitis-related liver fibrosis. (a) Histological images of liver sections: H&E (top row, ×200) and Masson (bottom row, ×200). (b) Blood biochemical analysis of mice. (c) Quantification of liver fibrosis using the METAVIR Scoring System in each group. (d) The hepatic ROS levels of mice by flow cytometry. Values are mean ± SD, ∗∗P < 0.01 vs. the control group, #P < 0.05, ##P < 0.001 vs. the MCD group.
