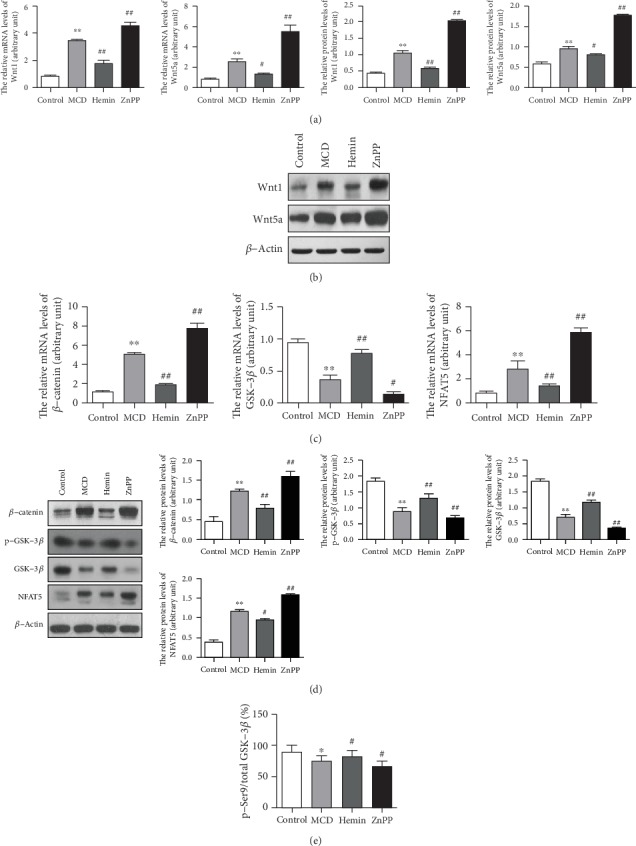
Figure 2.

HO-1 inhibited Wnt signaling pathway and downstream effectors. (a) mRNA and (b) protein levels of Wnt1 and Wnt5a were detected by qPCR and Western blot, respectively. (c) mRNA and (d) protein levels of Wnt signaling pathway downstream effectors were detected by qPCR and Western blot, respectively. (e) Densitometry analysis shows the band density ratio of p-GSK-3β (Ser9) to total GSK-3β. Values are mean ± SD; ∗P < 0.05, ∗∗P < 0.01 vs. the control group, #P < 0.05, ##P < 0.01 vs. the MCD group.
