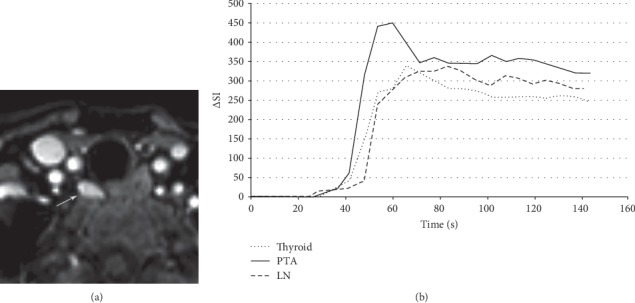
Figure 9.

Parathyroid adenoma on dynamic 4D contrast-enhanced magnetic resonance imaging (MRI). A 68-year-old female presents with primary hyperparathyroidism. An axial arterial phase contrast-enhanced image from magnetic resonance perfusion demonstrates a parathyroid adenoma (arrow) in the right tracheoesophageal groove. Concentration-time curve analysis from regions of interest placed over the parathyroid adenoma (arrow), thyroid gland, and a jugulodigastric lymph node shows significantly faster time-to-peak (TTP) and higher wash-in and washout values of the parathyroid adenoma compared to the thyroid gland and cervical lymph node. Parathyroid adenoma: TTP, 37 seconds; wash-in, 7.8; washout, 0.58. Thyroid: TTP, 42 seconds; wash-in, 5.4; washout, 0.46. Lymph node: TTP, 60 seconds; wash-in, 4.8; washout, 0.29. ΔSI indicates the change in signal intensity. Wash-in is the initial upslope of the concentration-time curve (slope from the end of the baseline to the peak of the curve). Washout is the downslope of the concentration-time curve (negative slope from the peak to the last acquisition time point) (figure reused with permission).
