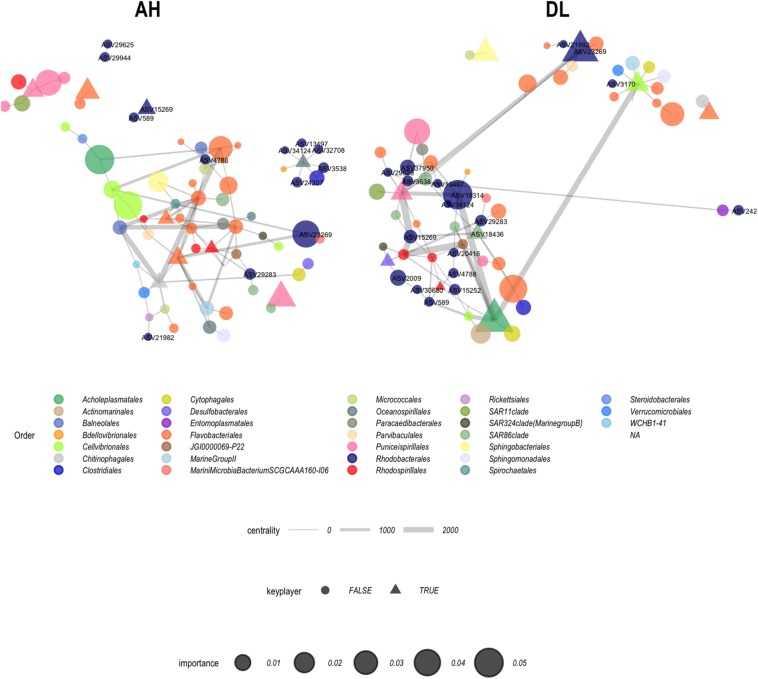
FIGURE 9.
Coral microbiome network analysis. Apparently healthy (AH) samples from the vulnerable zone (N = 15) and diseased colony lesion (DL) samples from epidemic zone (N = 20) were used to construct networks. Each node represents an amplicon sequence variant (ASV) and is sized based on the random forest importance value (scale provided). Shapes correspond to whether the ASVs were identified as a “key player” and the width of connecting lines denote ASV centrality (scale provided). Only Rhodobacterales (navy) nodes are labeled with their ASV numbers.

