
FIGURE 3.
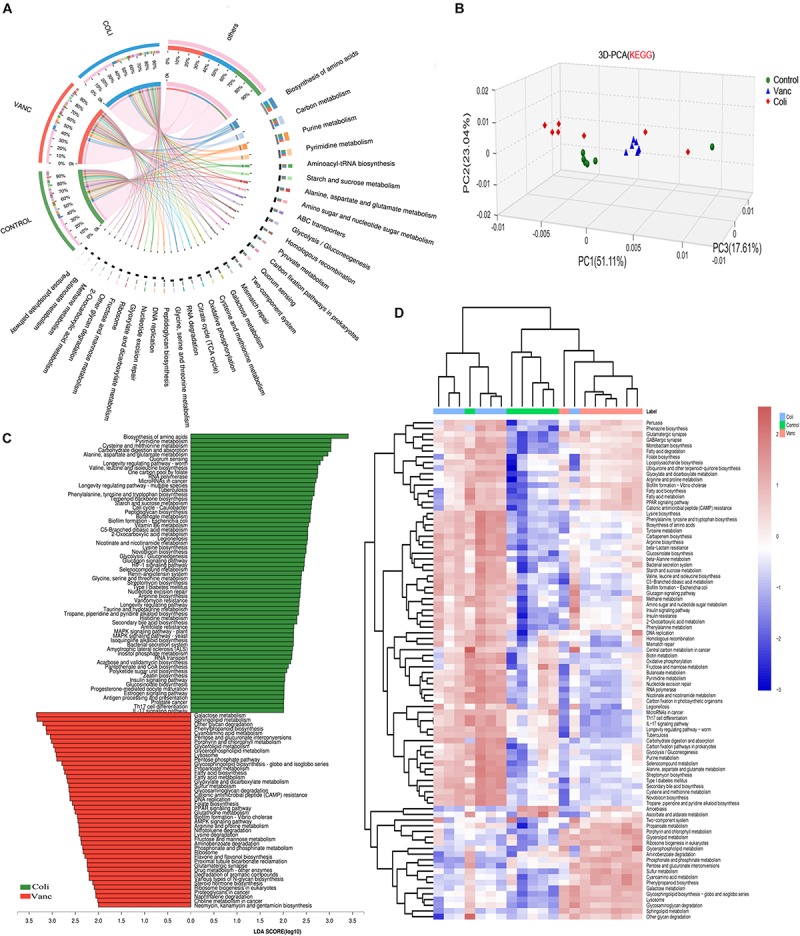
Metagenomic analysis of functional diversity of gut microbiota. (A) Circos of samples and functional KEGG pathways. (B) 3D-PCA for KEGG pathways. (C) LDA scores computed for differentially abundant taxa in the fecal microbiomes of Coli group and Vanc group. Length indicates effect size associated with a taxon. p = 0.05 for the Kruskal–Wallis test; LDA score > 3. (D) Unsupervised hierarchical clustering of KEGG pathways predicted in the metagenomes of fecal samples. Columns represent samples and rows represent enrichment of predicted KEGG pathways.