
FIGURE 5.
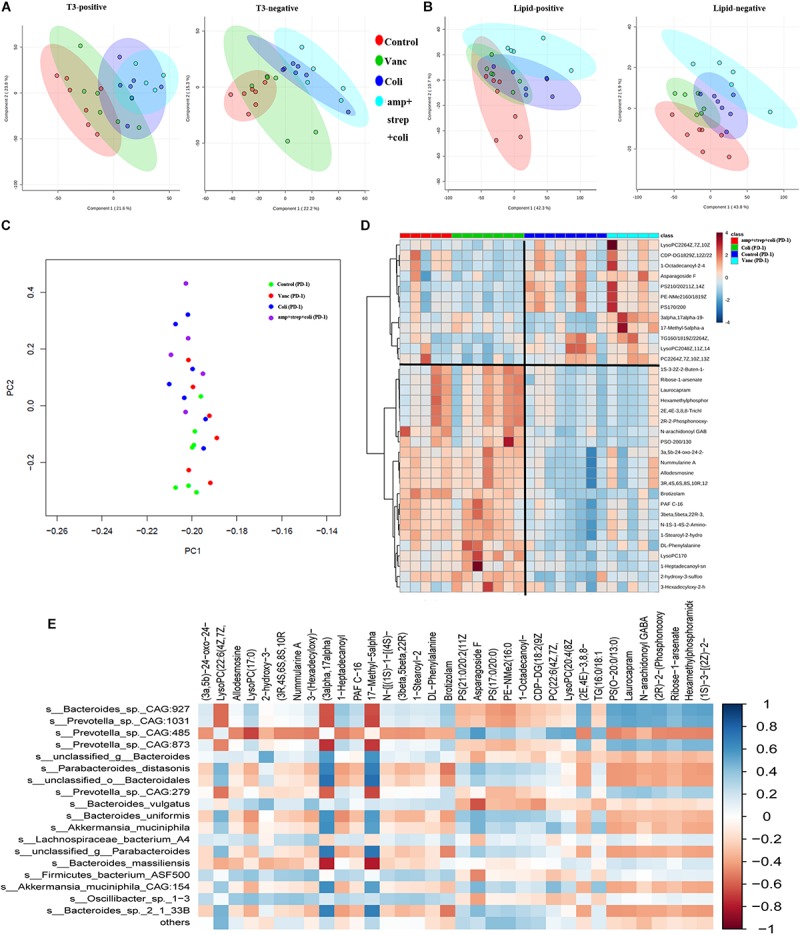
Gut microbiota induces specific changes in plasma lipids and metabolome. (A) PCA graphs of the plasma metabolome from QC samples in positive and negative metabolomics analysis. (B) PCA graphs of the plasma lipidome from all samples. (C) PCA of plasma metabolites from after PD-1 antibody treatment group mice. (D) Heatmap shows the normalized relative abundances of metabolites with annotation which were significantly changed in Control vs. Coli group and Vanc vs. Coli group. (E) Correlations between the gut microbiota (at the species level) and potential plasma compounds. Cells are colored based on Pearson correlation coefficient between predominant bacteria (relative abundance) and metabolites (normalized abundance) in plasma. The red color represents a significant negative correlation (P < 0.05), the blue color represents a significant positive correlation (P < 0.05).