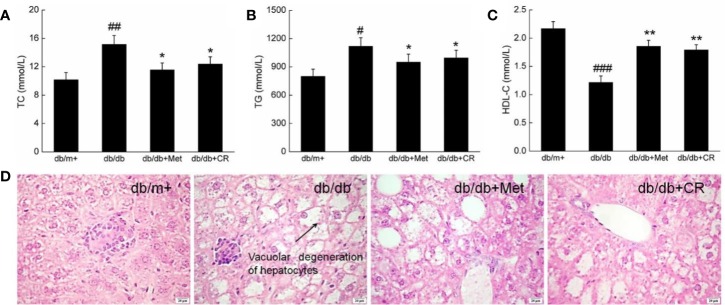
Figure 3.
CR treatment affected the (A) TC, (B) TG, and (C) HDL-C in the serum of db/db mice. The data were analyzed using a one-way ANOVA and expressed as mean ± SEM (n = 12). #P < 0.05, ##P < 0.01, and ###P < 0.001 versus db/+ mice, *P < 0.05 and **P < 0.01 versus non-treated db/db mice. (D) Histopathological analysis of the liver via H&E staining (scale bar: 20 μm; magnification: 400×). Arrow represents for vacuolar degeneration of hepatocytes of liver in db/db mice.

