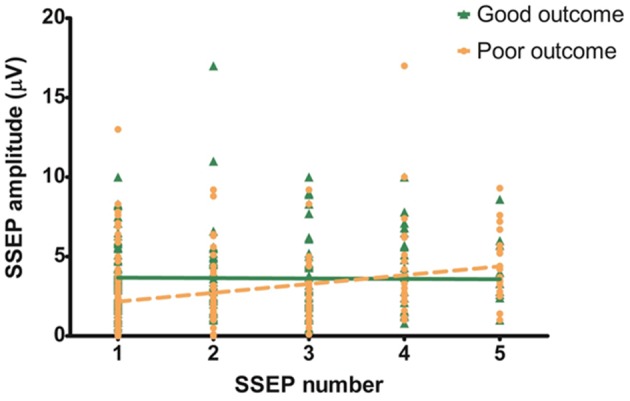
Figure 2.

Evolution of N20 amplitude over time. Slope of the good outcome groups is not significantly different from zero (−0.03 μV; 95% CI: −0.30–0.25; P < 0.05; R2: 0.00). Slope of the poor outcome group shows a statistically significant increase (0.55 μV; 95% CI: 0.33–0.78; P = 0.86; R2: 0.09).
