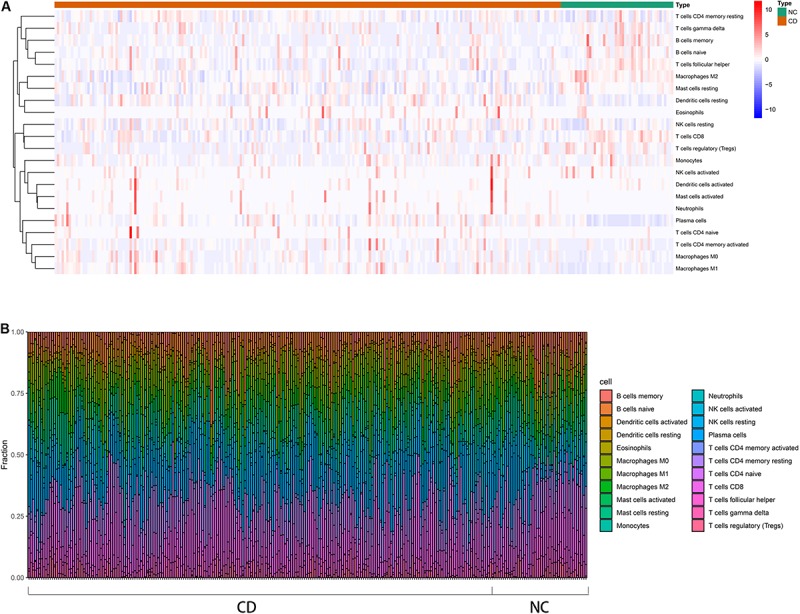
FIGURE 3.

Distribution of immune cells between CD patients and healthy controls using CIBERSORTx for all eligible samples in the derivation cohort. (A) Heatmap of the normalized absolute abundance for each cell type in individual samples. (B) Barplot of different the fractions of immune cells in individual samples.
