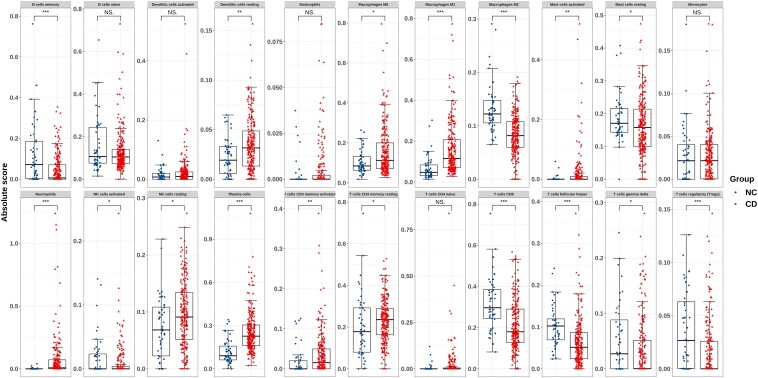
FIGURE 4.
Boxplot of comparisons of immune-cell proportion between CD patients and healthy controls in the derivation cohort. The red boxplot represents CD patients, and the blue boxplot represents healthy controls. The fraction of resting DCs, macrophages (M0 and M1), activated mast cells, and neutrophils were higher in CD patients, whereas the fraction of M2 macrophages, resting mast cells, and γδT cells were lower in CD patients. The number of resting NK cells, plasma cells, CD4 memory T cells (activated and resting) were elevated in CD, whereas that of activated NK cells, memory B cells, CD8 T cells, follicular helper T cells, and Tregs was lower. *p < 0.05, **p < 0.01, ***p < 0.001.

