
FIGURE 5.
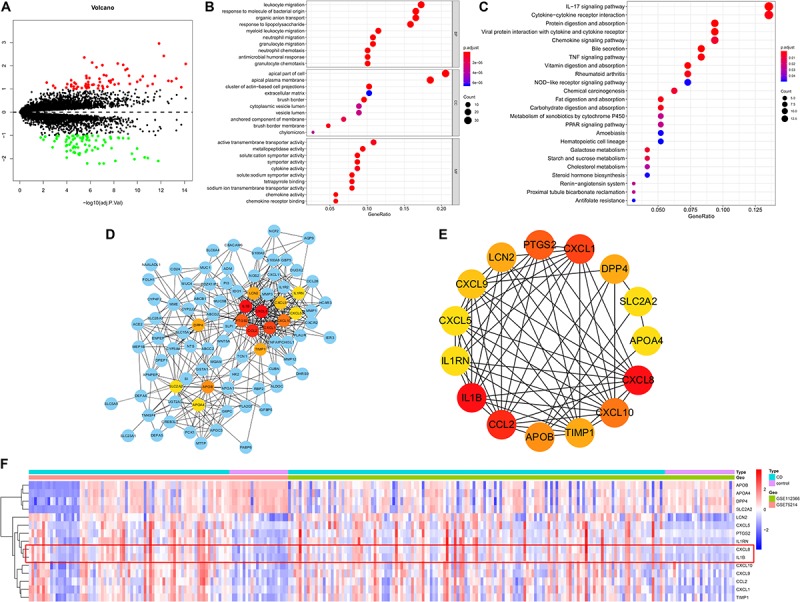
DEGs identified in the derivation cohort. (A) Volcano plot of DEGs. Red dots represent relatively upregulated genes and green dots represent downregulated genes. Black dots represent genes showing no significant alteration. There were 150 DEGs, including 70 upregulated and 80 downregulated genes among 17,689 genes. Bubble plot of (B) Gene Ontology and (C) KEGG enrichment analyses. (D) Cytoscape software was used for the analysis. (E) Hub genes with the top 15 degrees of interaction were identified using Cytohubba plugin. (F) Heatmap of the hub genes. BP, biological process; CC, cellular component; MF, molecular function.