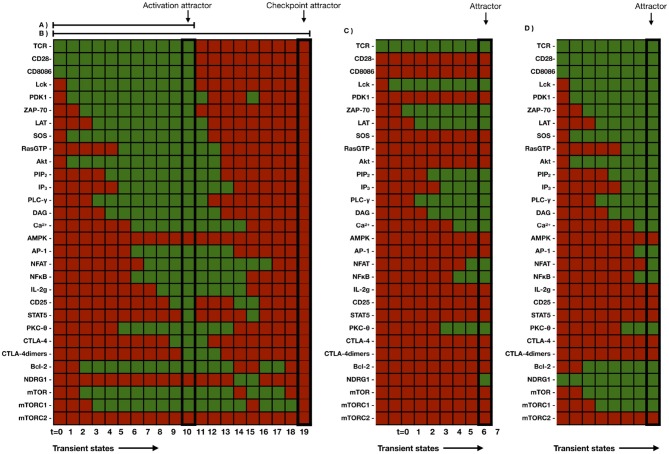
Figure 5.
(A) Intermediate states leading to T lymphocyte activation and anergy. Active and inactive nodes are shown in green and red, respectively. The transition states from time steps 0 to 10 represent progressive activation. CTLA-4 and CTLA-4 dimers are expressed in a late state of activation (step 10). (B) Persistent activation leads to the sustained expression of CTLA-4 dimers; interaction of this molecule with CD80/86 sequentially inactivates multiple nodes (steps 11–18) until the immune checkpoint state is reached. (C) Intermediate states leading to the anergy attractor shown in Figure 4 in the absence of co-stimulation. (D) Turning on the Ndrg-1 node at the onset of activation through the TCR and CD28 (simulating activation of Ndrg-1-overexpressing cells) leads to partial activation but inhibition of IL-2 synthesis.

