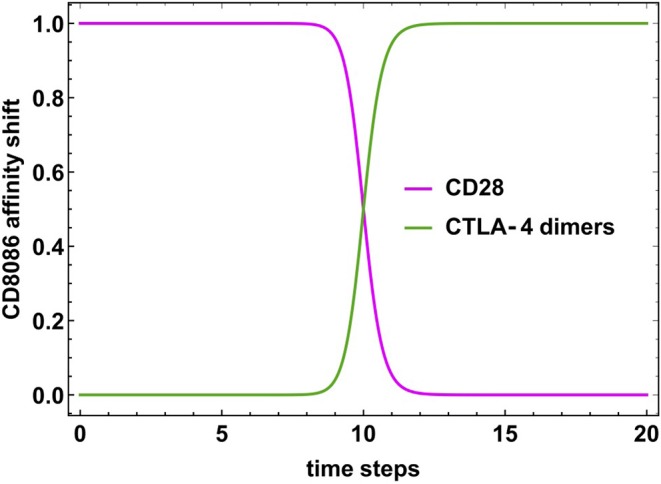
Figure 6.

Time-dependent activity of CD80/86 due to the shift of its relative affinity for CD28 and CTLA-4 dimers. The magenta curve describes the linkage strength of the CD80/86-CD28 complex which shows a steep decrease at td ≃ 10. The green curve describes the anticorrelated behavior of the linkage strength of CD80/86-CTLA-4 dimers complex.
