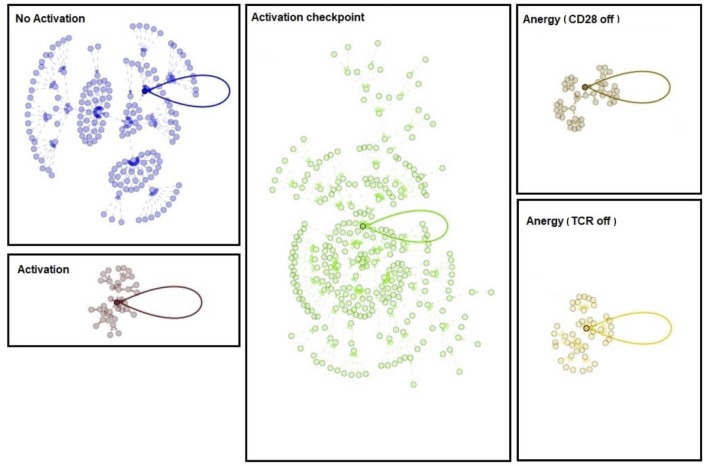
Figure 7.
Graphic representations of basins of attraction for the activation core obtained with a simplified 12-node network. The rules involved in the simplified network were rigorously obtained by straightforward use of Boolean algebra as described in the Appendix. In the graphs, initial conditions are represented by the outside layers. From these states, the system transits through intermediate state layers before reaching the final steady state indicated by the loops. The largest basins of attraction are those related with no activation and immune checkpoint states.

