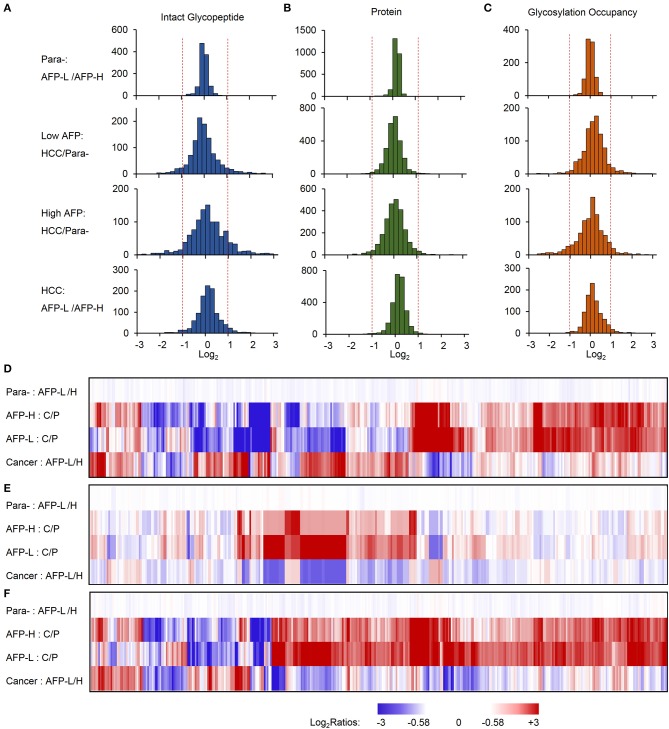
Figure 3.
Relative quantification of intact glycopeptides, proteins, and glycosylation occupancies among different sample groups. (A–C) The frequencies of intact glycopeptides (A), proteins (B), and glycosylation occupancies (C) were compared between paracancer tissues with low and high AFP (upper), low AFP HCC tumors and their paired paracancer tissues, high AFP HCC tumors and their paired paracancer tissues, as well as HCC tumors with low and high AFP (lower). (D–F) Heat map shows the fold changes of altered intact glycopeptides (D), corresponding proteins (E) and glycosylation occupancies (F) among four sample groups. AFP-L: low AFP; AFP-H: high AFP; Para-: paracancer tissue; C/P: cancer/paired paracancer.

