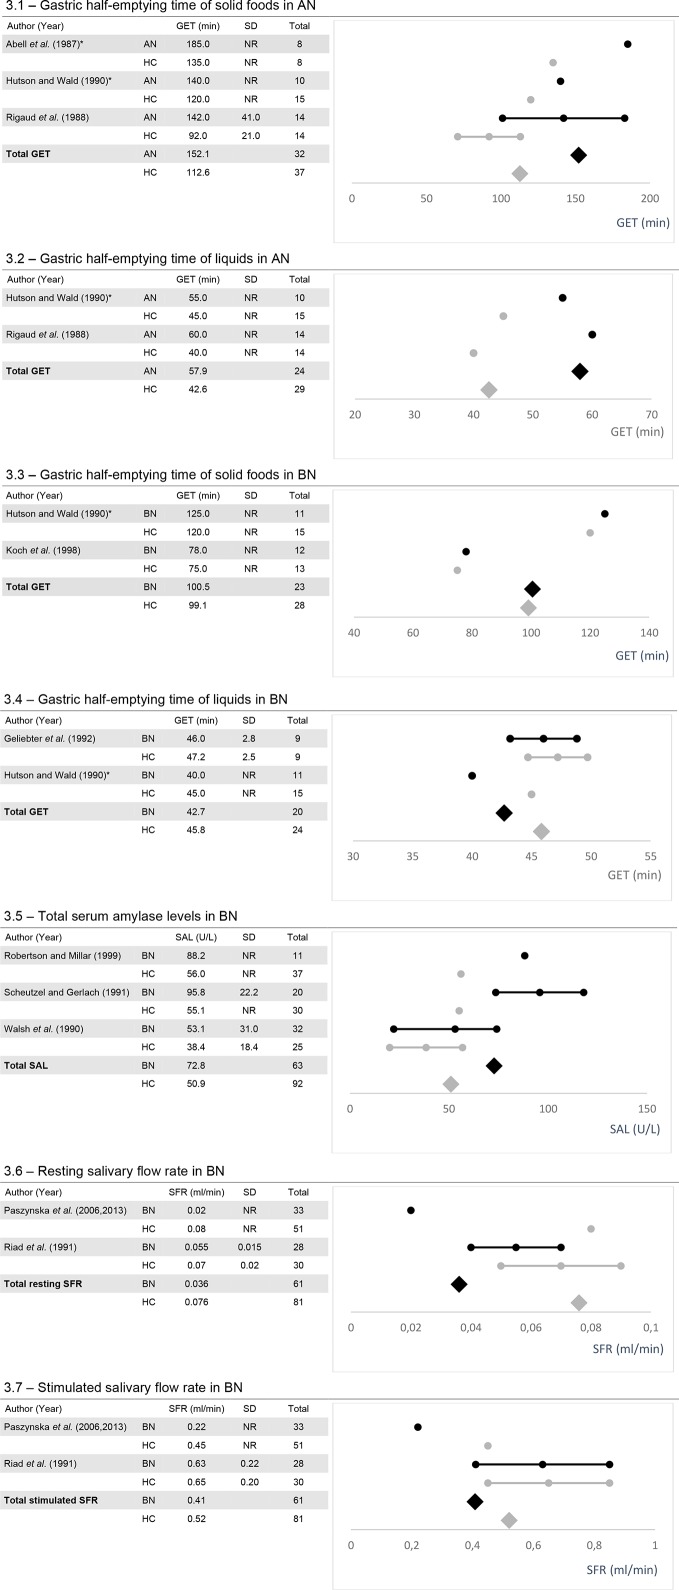
Figure 3.
The figures show the mean values, standard deviation (SD) if reported and, calculated weighted total values for gastric half-emptying time (GET; 3.1-3.4), serum amylase levels (SAL; 3.5) and salivary flow rate (SFR; 3.6 and 3.7) along with the number of total participants (Total). AN, Anorexia nervosa; BN, Bulimia nervosa; HC, healthy controls; NR, Not reported. *Data were taken from figures.

