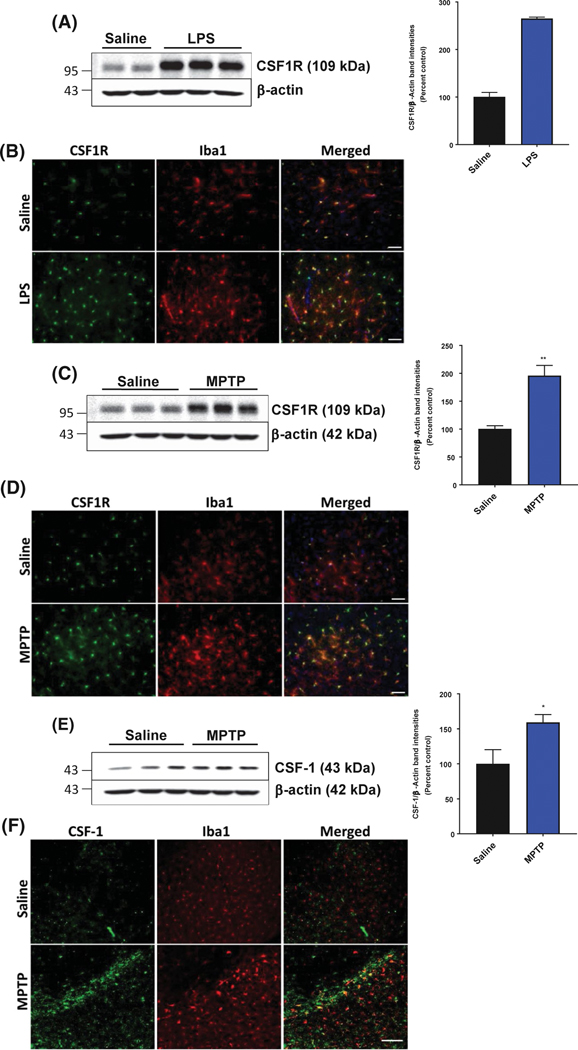
FIGURE 2.
CSF1R and CSF-1 protein levels are increased in the nigrostriatal pathway following neurotoxicant treatment. A and B, Increased protein level of CSF1R in the mouse striatum was treated with LPS by western blotting (A) and SN by immunofluorescent microscopy (B) (20× magnification, scale bar 50 μm). C and D, Increased protein level of CSF1R in the mouse striatum was treated with MPTP by western blotting (C) and SN by immunofluorescent microscopy (D) (20× magnification, scale bar 50 μm). E and F, Increased protein level of CSF-1 in the mouse striatum was treated with MPTP by western blotting (E) and representative immunofluorescent microscopy images (F; 10× magnification, scale bar 40 μm) for CSF-1 (green) levels and Iba1-positive (red) cells of the SN following either saline or MPTP treatment. All data are presented as means ± SEM; n = 2–4 mice per group; *P < .05, **P < .01 and ***P < .001

