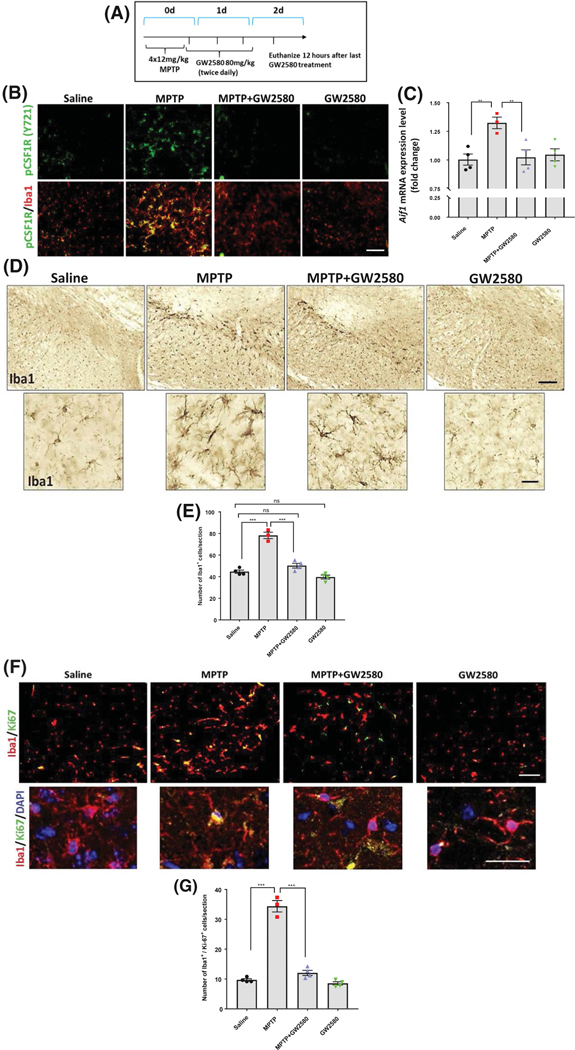
FIGURE 3.
Pharmacological inhibition of CSF1R with GW2580 attenuates MPTP-induced microglial proliferation without ablation of the basal microglia population. A, To measure neuroinflammation, animals were sacrificed 2 days after acute MPTP treatment. B, Representative immunofluorescent images of phosphorylated CSF1R (Y721) in green and Iba1 in red following MPTP and GW2580 treatment (scale bar, 40 μm). C, Gene expression of Aif1 measured in the mouse striatum. D, DAB immunostaining of Iba1-positive cells in the SN following MPTP and GW2580 treatments (4.2× images, top panel; scale bar, 40 μm), along with 40× magnification images for cellular morphology (bottom panel, scale bar 10 μm). E, Quantification of Iba1- positive cell numbers per section in the SN after MPTP and GW2580 treatments. F, Immunofluorescent staining of the SN for the cell proliferation marker Ki-67 (green) in Iba-1 positive (red) cells (10× magnification, scale bar 40 μm) with higher magnification (40× magnification, scale bar 25 μm) images including DAPI nuclear stain (blue). G, Total counts of Iba1-positive cells that were also positive for Ki-67 per section in the SN. All data are represented as mean ± SEM; n = 3–4 mice per group; *P < .05, **P < .01, ***P < .001, ns = not statistically significant P > .05

