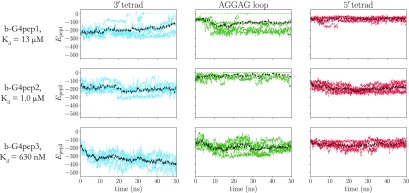
Figure 5.
Calculated interaction energies in the molecular dynamics simulations for b-G4pep1 to b-G4pep3 with ckit-1 in explicit solvent, alongside experimental Kds. The plots show the evolution of all trajectories (in color) and the moving average value (black). The interaction for b-G4pep3 with the binding site between the 3′-tetrad and the AGGAG loop is the strongest.

