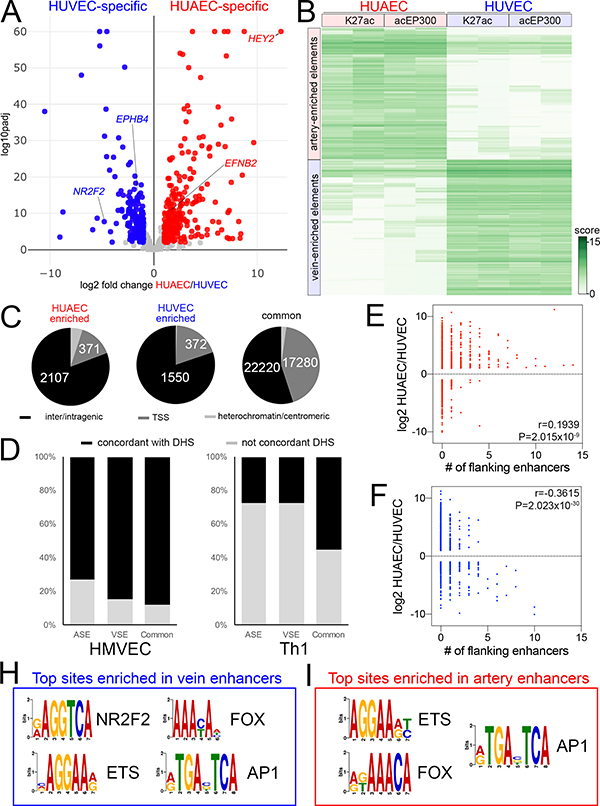
Figure 1. Genome-wide identification of artery and vein enhancers.
A, Volcano plot of HUAEC/HUVEC RNAseq. Red and blue indicates significantly-enriched HUAEC- and HUVEC-specific genes, respectively (log2 fold change >= 1, or <=−1, padj <=0.01). Grey indicates genes that are not significantly changed. Selected artery- and vein-specific genes are noted. B, Binding affinity heat map showing normalized read density (score) of replicate acEP300 and H3K27ac ChIP-seq samples from HUAEC and HUVEC. Only features with FDR<0.01 are shown. C, Pie charts showing distribution of HUAEC, HUVEC and common elements at inter/intragenic regions, transcriptional start sites (TSS) or heterochromatin/centromeric regions. D, Proportion of indicated elements concordant to DNAseI hypersensitivity I sites (DHS) from human microvascular endothelial cells (HMVEC) or T helper cells (Th1). E,F, Plots showing relationship between fold-enrichment in HUAEC or HUVEC and number of flanking E, artery-specific, or F, vein-specific enhancers. r and P values from Pearson Correlation are shown. H, I, Selected over-represented sites in H, vein-specific or I, artery-specific enhancers. Also see Online Tables V and VI.

