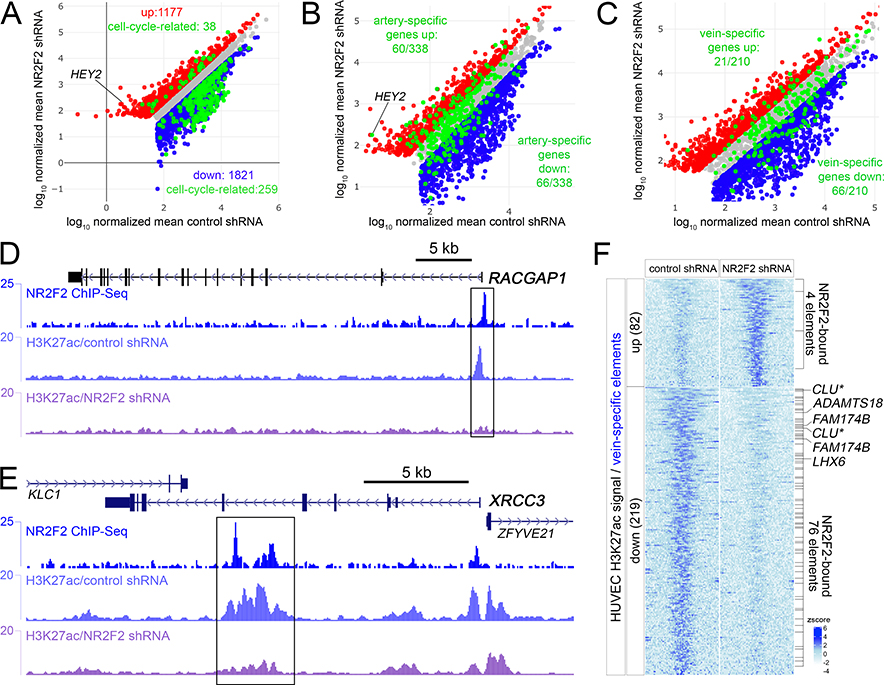
Figure 2. NR2F2 directly induces cell cycle and vein-specific genes.
A-C, Scatterplots of regulated genes following NR2F2 knockdown in HUVEC. Red and blue dots indicate genes significantly up and down regulated (log2 fold change >= 1, or <=−1, padj <=0.01), respectively. X- and Y-axes are log10 of mapped read counts of triplicate samples normalized by Median Ratio Normalization. The same scatter plot is shown at different magnification in each panel. Grey dots indicate genes that are not significantly changed. A, Green dots indicate cell-cycle genes that are significantly regulated. B, Green dots indicate all artery-specific genes. C, Green dots indicate all vein-specific genes. D, E, NR2F2 and H3K27ac ChIP-seq tracks at the D, RACGAP1, and E, XRCC3 loci. Boxes indicate regions bound by NR2F2 and showing significantly decreased H3K27ac (log2FC<=−1, FDR<0.05) following NR2F2 knockdown in triplicate samples. F, Heatmap of H3K27ac reads mapped to vein-specific elements significantly regulated (log2 fold change >= 1, or <=−1, FDR<=0.05; zscore = average of normalized read depth, n=3) by NR2F2 knockdown in HUVEC. NR2F2 bound elements are indicated, as are closest down-regulated genes following NR2F2 knockdown. Asterisk for CLU indicates that it falls just under the fold-change threshold for being an NR2F2-regulated gene (log2FC=−0.92, padj<0.01).

