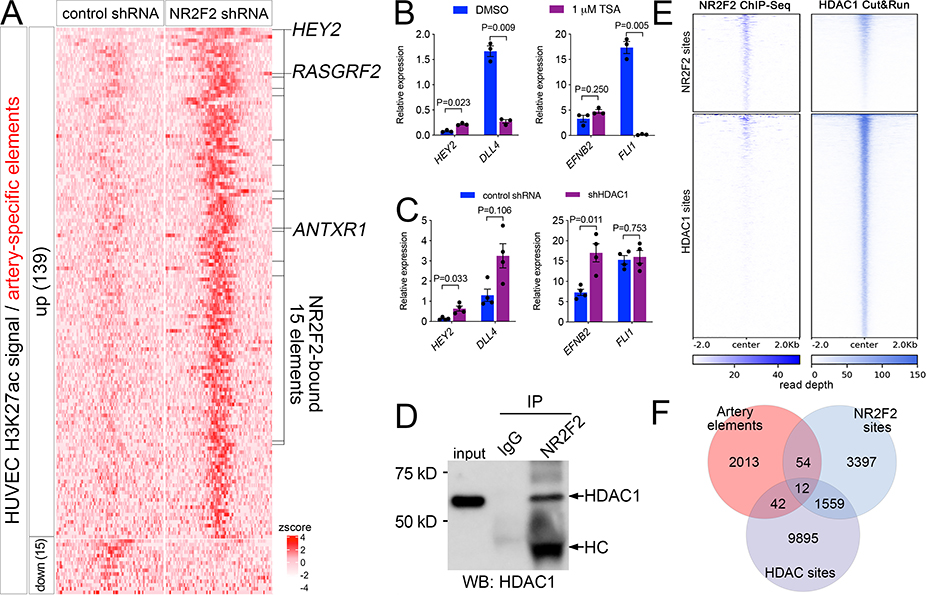
Figure 4. NR2F2 represses artery-specific elements.
A, Heatmap of K27ac ChIPseq reads mapped onto artery-specific elements. Only elements with significant differences are shown (log2 fold change >= 1, or <=−1, FDR<=0.05; zscore = average of normalized read depth, n=3). NR2F2 bound elements are indicated, as are closest genes up-regulated by NR2F2 knockdown. B, C, qRT-PCR to detect indicated transcripts, Student’s t-test or Wilcoxon signed rank-sum test (B, EFNB2). B, HUVEC treated with DMSO or indicated concentration of TSA, n=3. C, HUVEC expressing control or HDAC1 shRNA, n=4. D, Immunoblot to detect HDAC1 in lysates from HUVEC immunoprecipitated with IgG or NR2F2 antibody. HC – denotes heavy chain of NR2F2 antibody. E, Heat map of read depth from single replicates of HDAC1 Cut&Run or NR2F2 ChIP-seq mapped onto NR2F2 and HDAC1 binding sites. F, Venn diagram indicating intersection of artery-specific elements, NR2F2 sites and HDAC1 sites.

