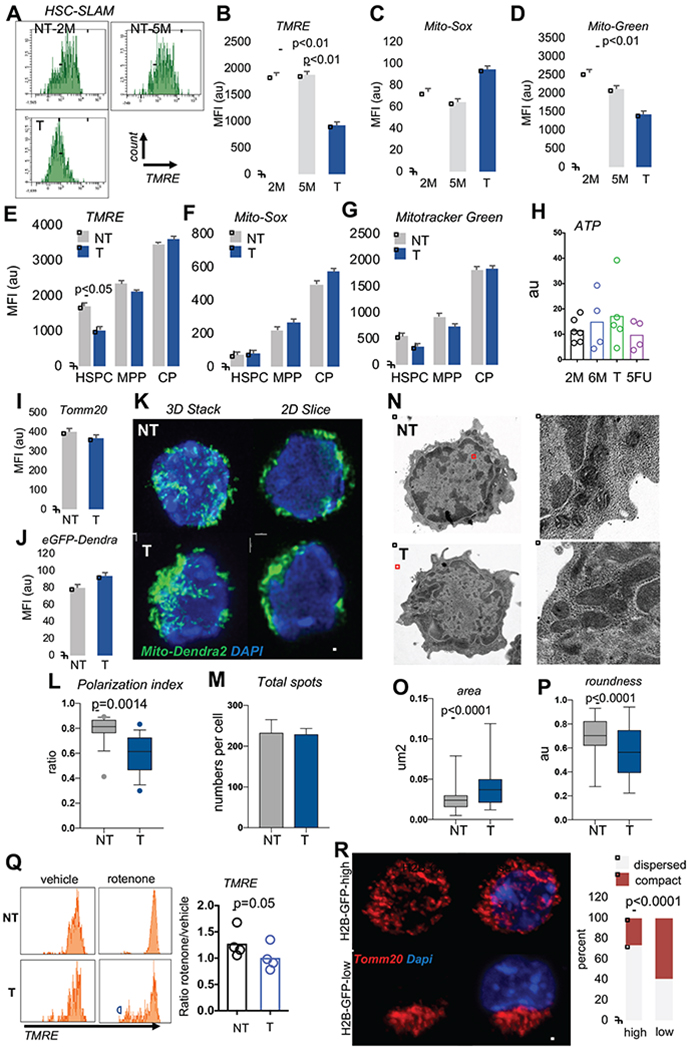
Figure. 1. HSC keep dysfunctional mitochondria after replication.

(A) Representative flow cytometry histogram of mitochondrial TMRE levels in 2 month(M)-old and 5 month-old non-transplanted [NT] mice, and transplanted [T] mice.
(B-D) quantification of mitochondrial parameters in 2M-old, and 5M-old NT SLAM and T SLAM, (mean±sem; n=7 mice).
(E-G) quantification of mitochondrial parameters, mean±SD, n=6 mice. (HSPC: LSK-CD48-; MPP: LSK-CD48+; CP:LK)
(H) quantification of ATP production in SLAMs from NT (2M, 6M), T and 14 days after 5FU (mean±SD, n=5).
(I) mitochondrial mass in NT and T SLAMs using Tom20 staining, mean fluorescent intensity (MFI) of Tom20 staining (mean±SD, n=203 in NT; 95 in T).
(J) Quantification of mito-Dendra2 MFI by flow cytometry mean±SD, n=6 mice.
(K) Representative IF images of mito-Dendra2 NT or T SLAM, shown as a 3D stack or one 2D slice view. scale bar 2μm.
(L-M) Mito-Drendra2 signals analyzed in Imaris using spot detection algorithm positioned relative to a reference point. (L) Polarization of mitochondrial spots per cell. (M) Total number of mito-Dendra2 spots per cell (n=24 NT and 20T, one representative experiment of 3)
(N-P) Mitochondrial analysis using transmission electron microscopy. (N) Representative images of NT and T SLAM. Zoom view of cell area highlighted in red is shown on the right images. (O) Area occupied by mitochondria. (P) quantification of roundness of mitochondria. (n=77 NT, 99 T mitochondria in 24NT and 19T cells).
(Q) Flow cytometry histogram and quantification of TMRE in NT and T HSPC after treatment with rotenone (1uM). (mean±s.e.m, paired student T-Test).
(R) Representative IF images of Tom20 staining in SLAMs from GFP-labeled H2B mice [high GFP and low GFP] isolated after 5 months of doxycycline removal and frequency of SLAMs with large mitochondrial clusters (n=90-100 cells; exact fisher test). All data are from 2-3 independent experiments. scale bar 2μm
