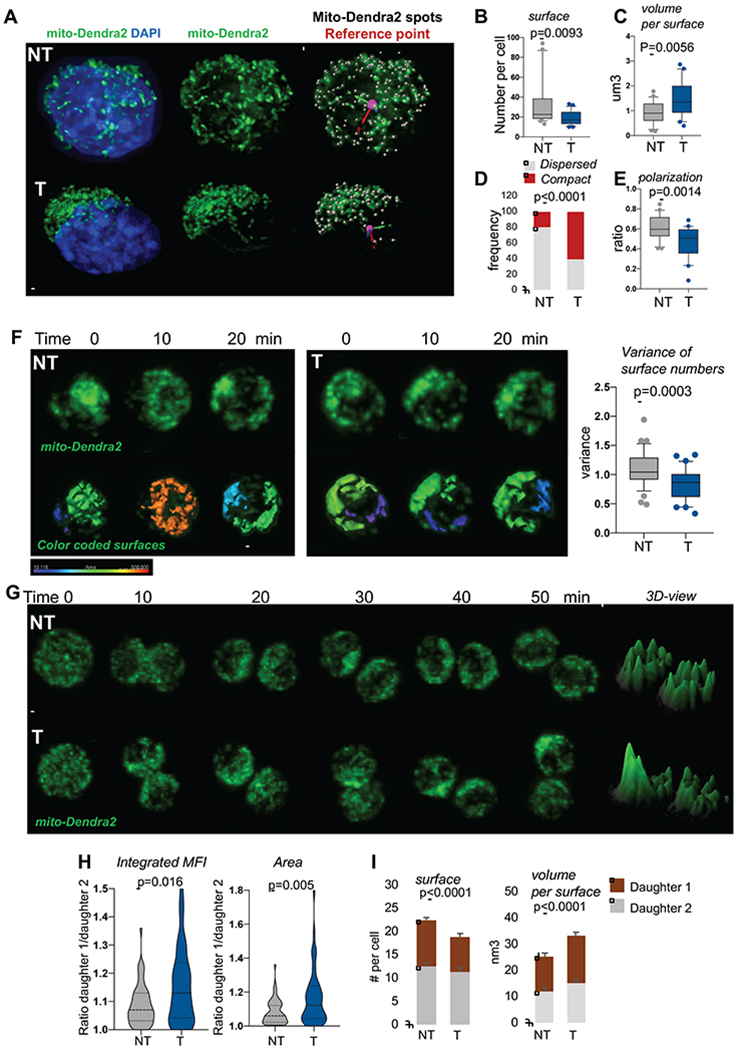
Figure 2. Mitochondria are asymmetrically inherited during HSC division.

(A) Representative IF images of mitochondria in activated SLAMs, scale bar 1μm. Mitochondria in green, nucleus stained with DAPI in blue. Scale bar 2μm
(B-C) Mitochondrial network analyzed using Imaris surface building algorithm. (B) Number of separated mito-Dendra2 segments identified as surfaces per cell. (C) Average volume per mito-Dendra2 segments per cell, n=21 NT and 25 T.
(D) Quantification of cells observed with dispersed versus compact mitochondrial organization; n=57 for NT, 74 for T, fisher exact test.
(E) Quantification of polarization of mitochondria, n=23 NT and 24 T.
(F) NT and T mito-Dendra2 SLAM were imaged live during interphase for several minutes. Representative IF images and quantification of mitochondrial motility. Graph is variance of surfaces per time point, n=36. Scale bar 5μm
(G-I) NT and T mito-Dendra2 SLAM divisions were traced in vitro using live IF. (G) Representative images of mitochondria during mitosis, 3D representation of maximum intensity project using ImageJ. Scale bar 5μm (H) Integrated MFI and area occupied by mitochondria per daughter cell. Graph is ratio of each paired-daughter cell, n=55 NT and 44 T, Mann Whitney Test. (I) quantification of mitochondrial inheritance using Imaris surface building, numbers of surface per cell and average volumes per mitochondrial objects per cell are shown, mean±SD, n=30-35 cells.
