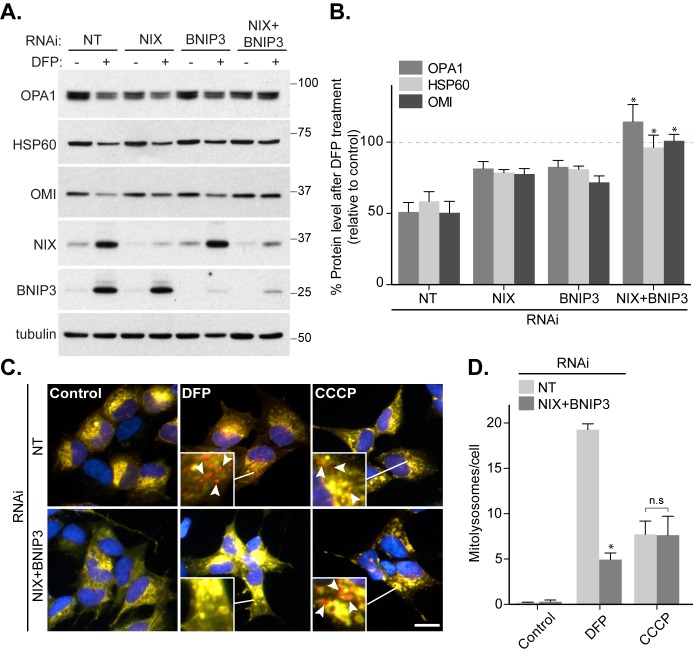
Figure 2. FIGURE 2: NIX and BNIP3 redundancy in DFP-induced mitophagy.
(A) Control SH-SY5Y cells or SH-SY5Y cells stably expressing BNIP3 shRNA were either transfected with non-targeting (NT) siRNA or NIX siRNA. 48 h post-transfection cells were treated with 1 mM DFP for a further 24 h. (B) Quantitation from (A) of OPA1, HSP60 and OMI levels relative to control condition. Dotted line represents control value (100%). (C) Control SH-SY5Y cells were transfected with NT siRNA and SH-SY5Y cells stably expressing BNIP3 shRNA were transfected with an equal amount of NIX siRNA. Cells were treated with 1 mM DFP or 20 μM CCCP for 24 h. Arrows highlight examples of mitolysosomes. Scale bar, 10 μm. (D) Quantitation from (C) of mitolysosomes per cell as indicated. All quantitative data are mean ± SEM from 3 independent experiments. * P < 0.05, n.s, not significant.

