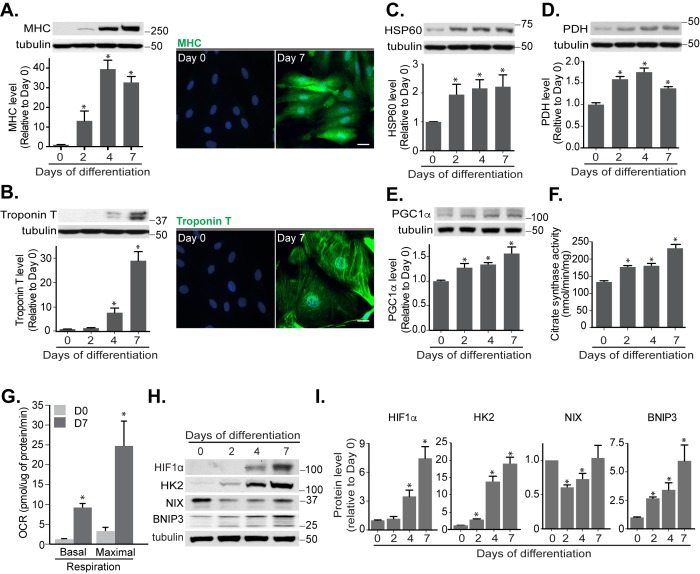
Figure 3. FIGURE 3: Mitochondrial functions increase during cardiomyoblast differentiation.
Protein levels and immunofluorescence staining of myosin heavy chain (MHC) (A) and cardiac Troponin T (B) were performed in H9c2 cells following differentiation for 0, 2, 4 and 7 days. HSP60 (C), PDH (D), PGC1α (E) protein levels and citrate synthase activity (F) were determined during this period. (G) Oxygen consumption rate (OCR) was measured in H9c2 cells following 7 days differentiation. (H-I) HIF1α, Hexokinase 2 (HK2), NIX and BNIP3 protein levels were examined and quantified in H9c2 cells during the indicated days of differentiation. α-tubulin was used as a loading control. All quantitative data are mean ± SEM from 3 independent experiments. Scale bar, 20 μm. * P < 0.05.

