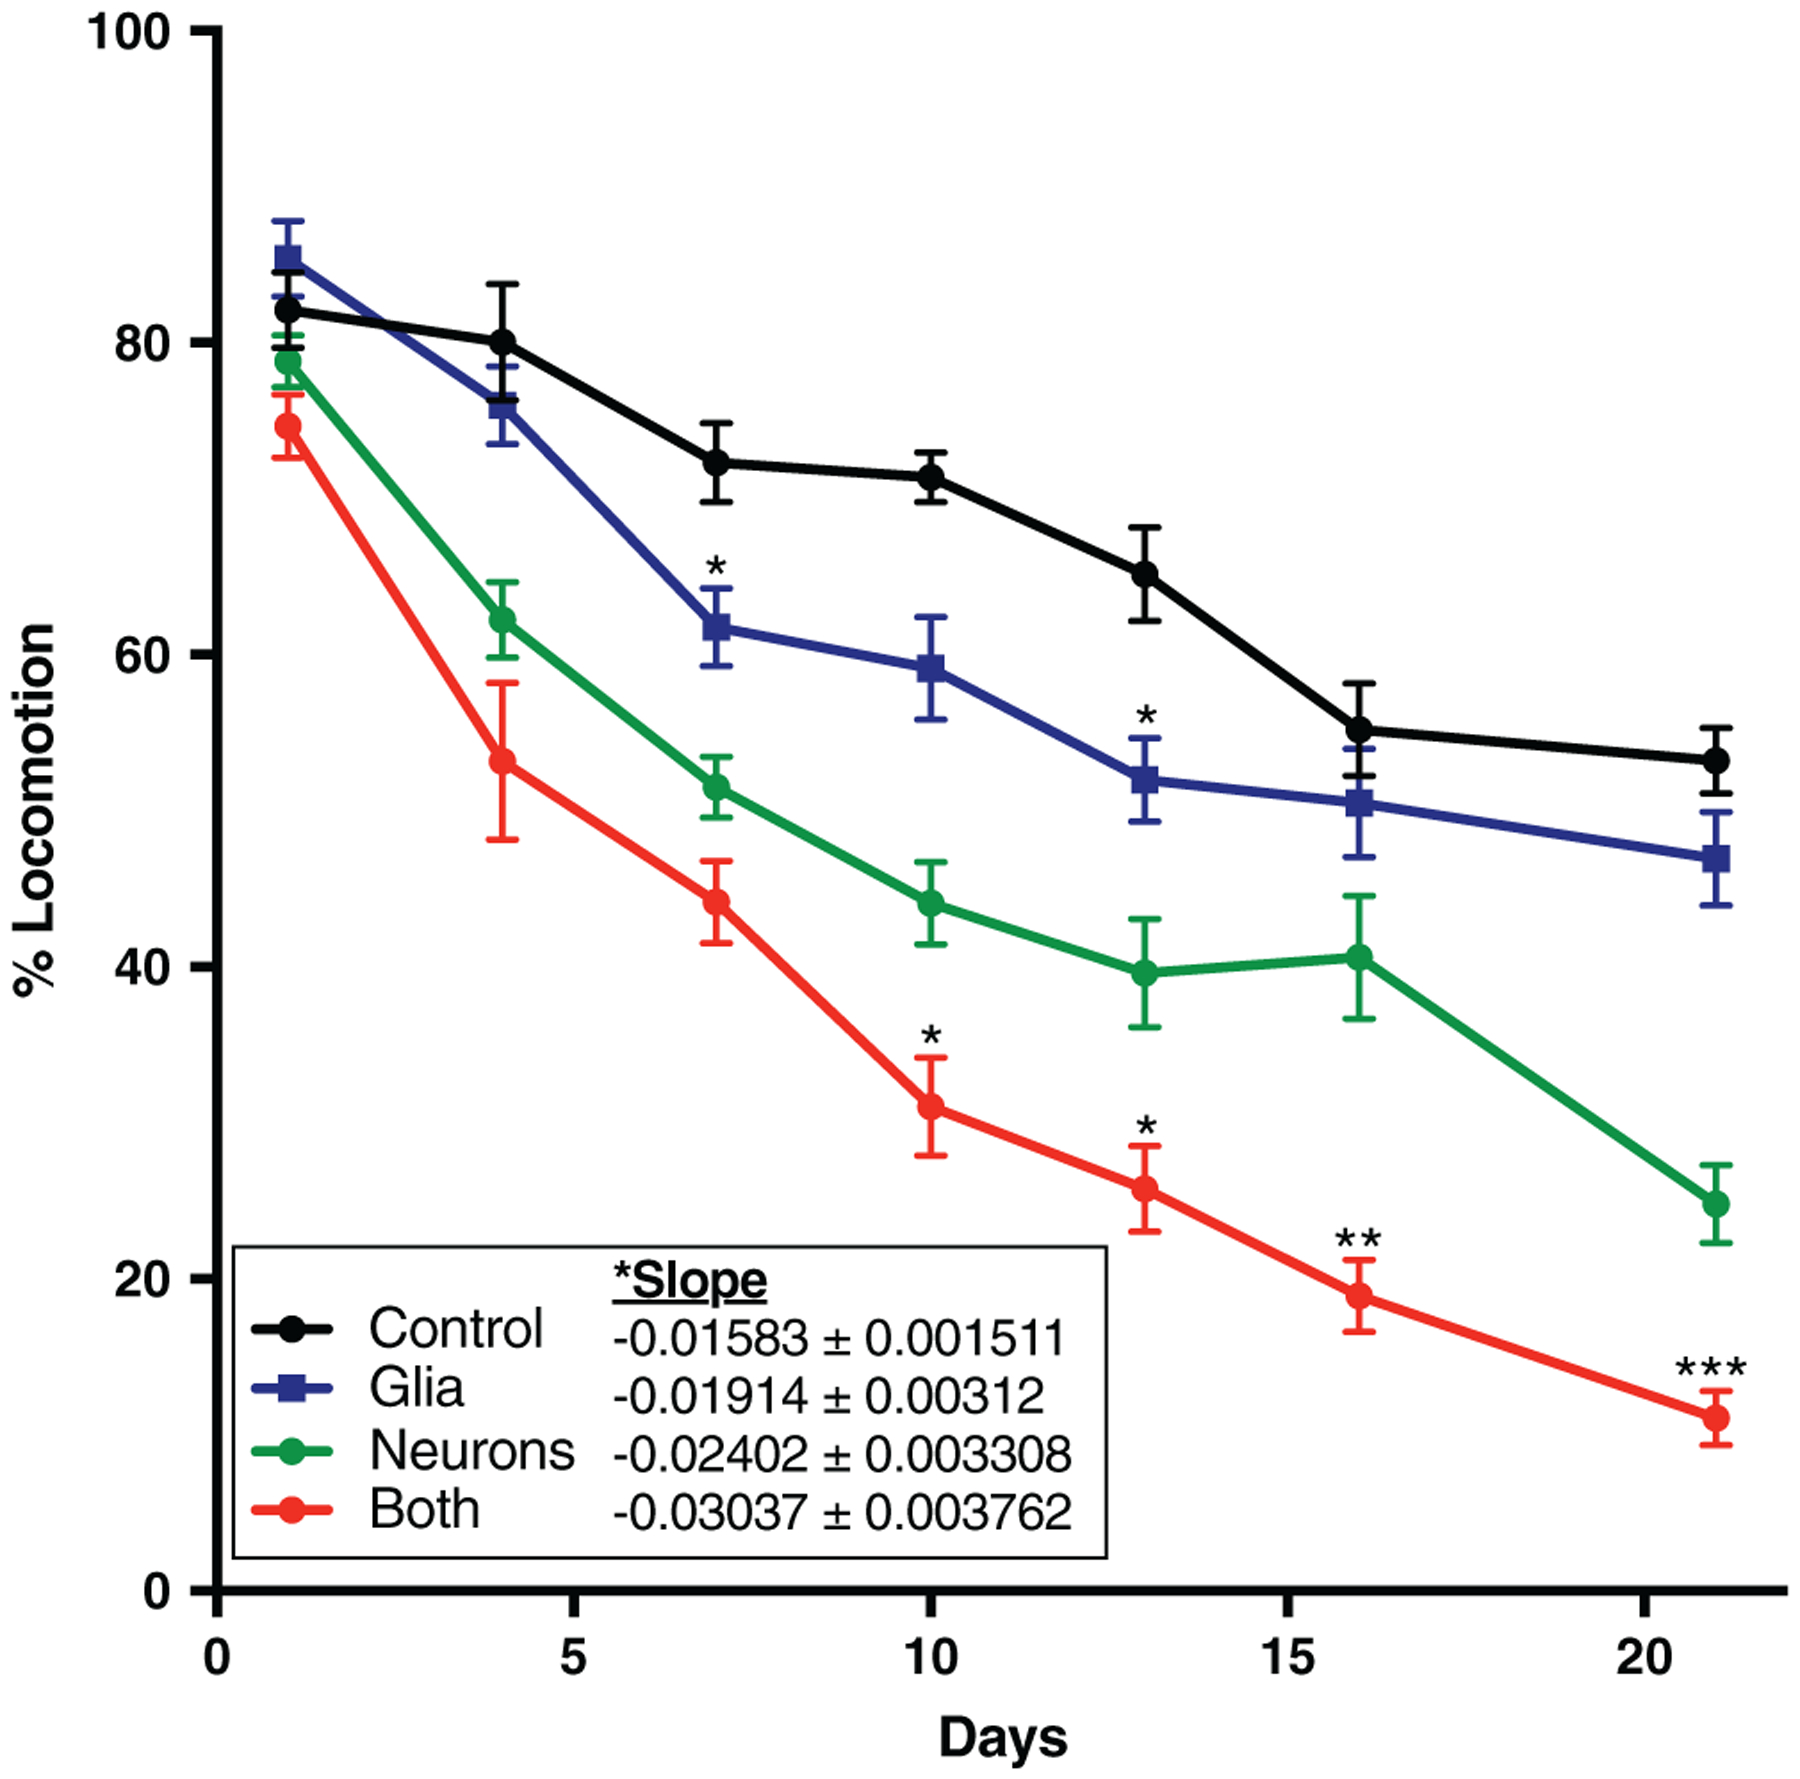
FIGURE 1.

Glial α-synuclein impairs locomotion. Flies were subjected to a gentle tapping stimulus followed by a 15-s delay. The percentage of flies still in motion (% locomotion) following the delay was recorded and averaged over six technical replicates. Symbols above the “Glia” and “Both” curves represent statistically significant difference compared to the “Control” and “Neurons” curves, respectively, at a given time point. Slope of the line was determined by linear regression analysis and was also globally statistically significantly different between the four conditions. *p < .05, **p < .01, ***p < .005. n = minimum of 60 flies per genotype per time point (six biological replicates of 10 flies each)
