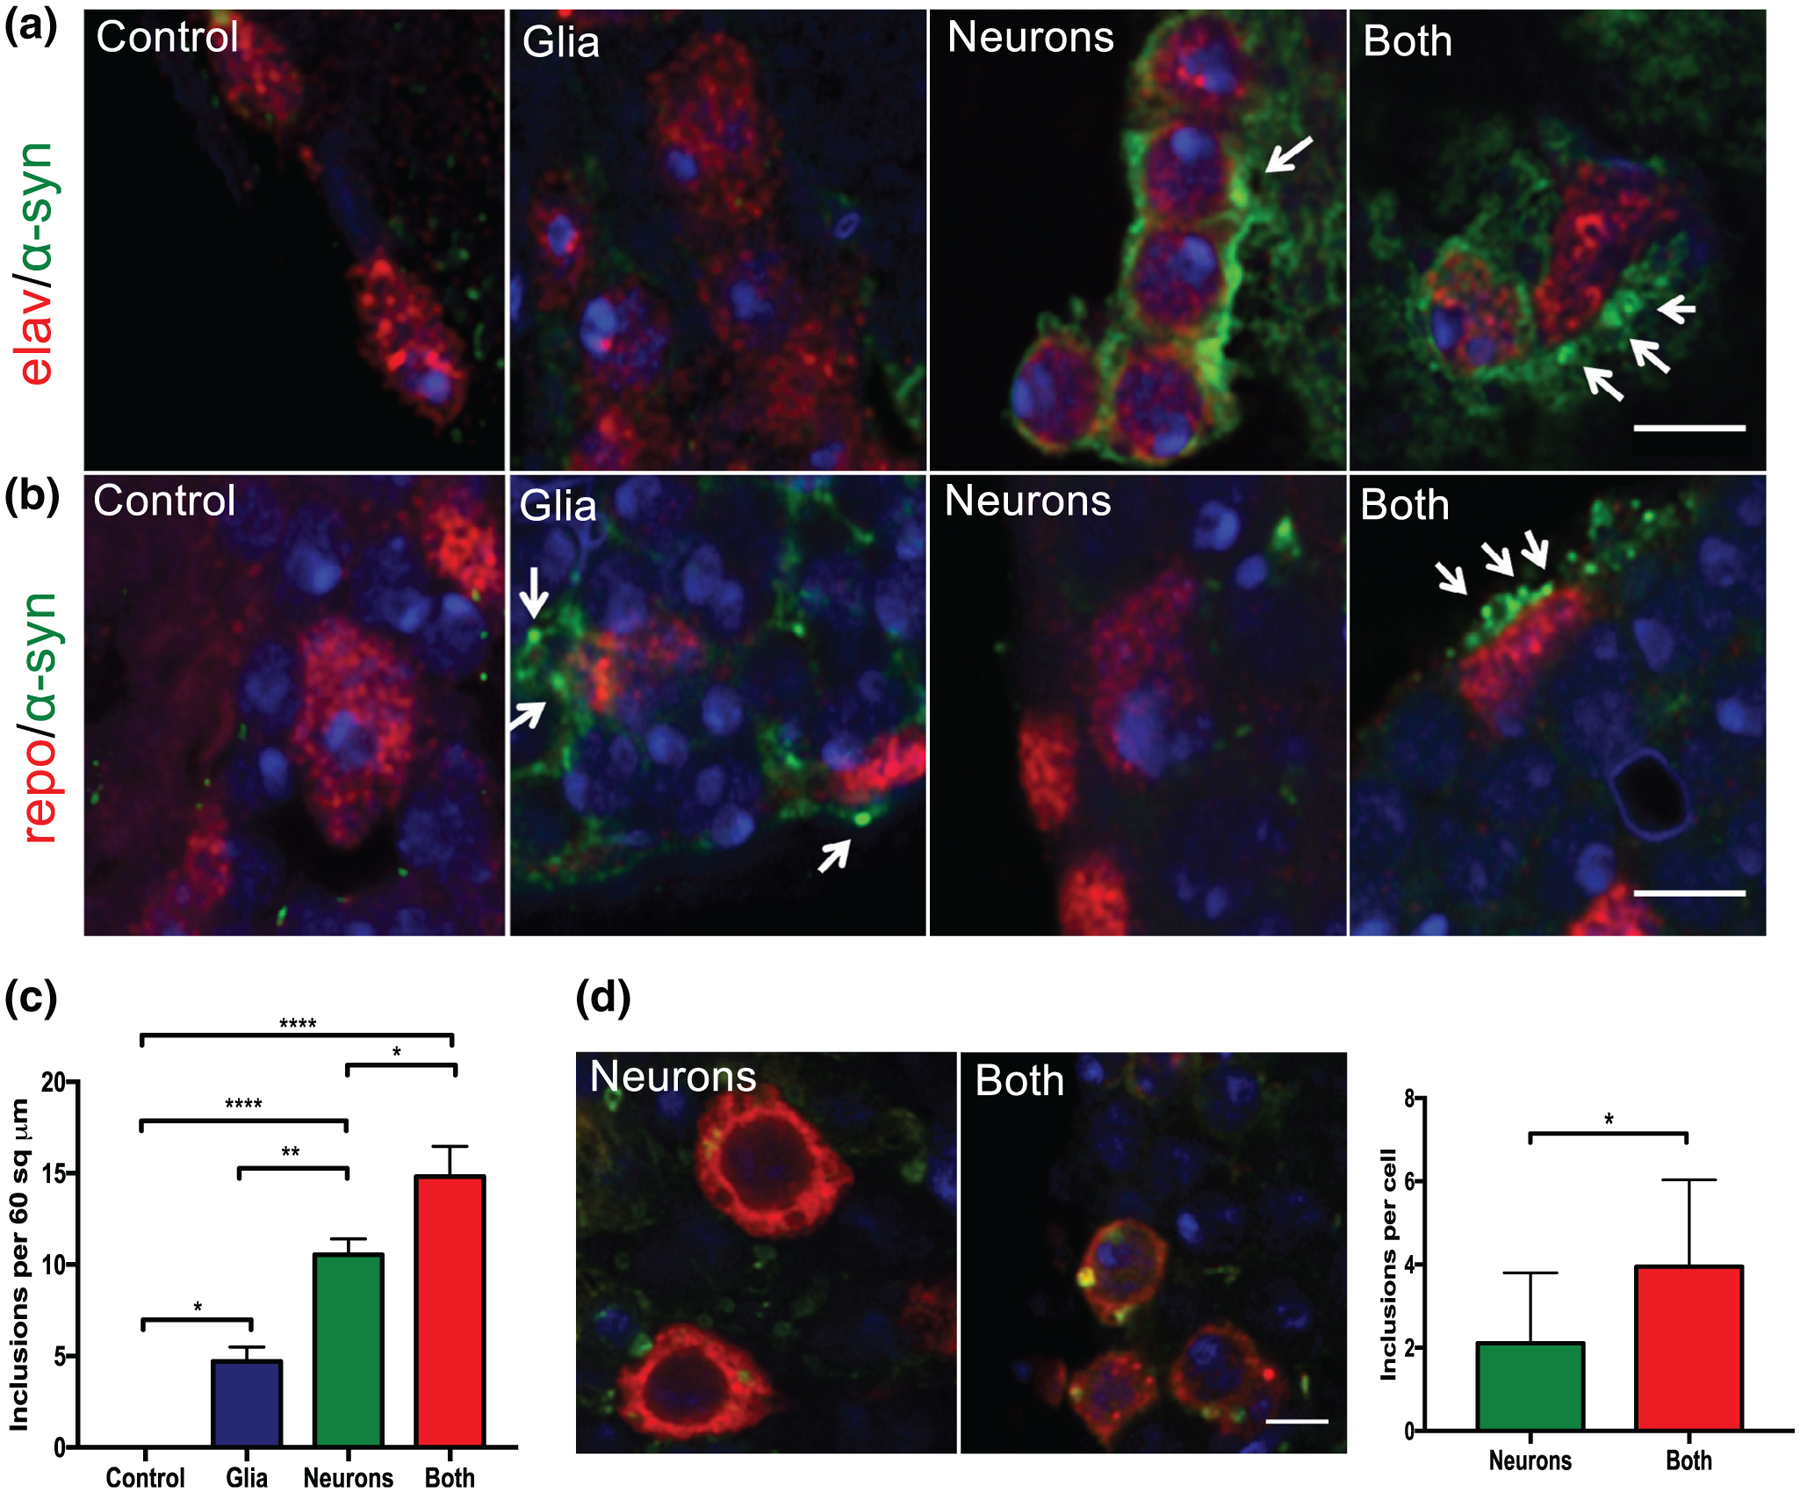
FIGURE 4.

α-Synuclein aggregates in neurons and glia. (a) Immunofluoresence for DAPI (blue), elav (red, mouse 1:5, DSHB), and α-synuclein (green, rabbit 1:1000) by confocal microscopy (3 μm scale). Arrows indicate α-synuclein inclusions in neurons. (b) Immunofluoresence for DAPI (blue), repo (red, mouse 1:5, DSHB), and α-synuclein (green, rabbit 1:1000) by confocal microscopy (3 μm scale). Arrows indicate α-synuclein inclusions in glia. (c) Quantification of total aggregates from optic lobe cortex, n = 5–six flies per genotype. (d) Representative immunofluorescence for tyrosine hydroxylase (red, mouse, 1:200, Immunostar), α-synuclein (green, rat, 1:10,000, Biolegend), and DAPI. Scale bar = 5 μm. Inclusions are quantified in the right panel
