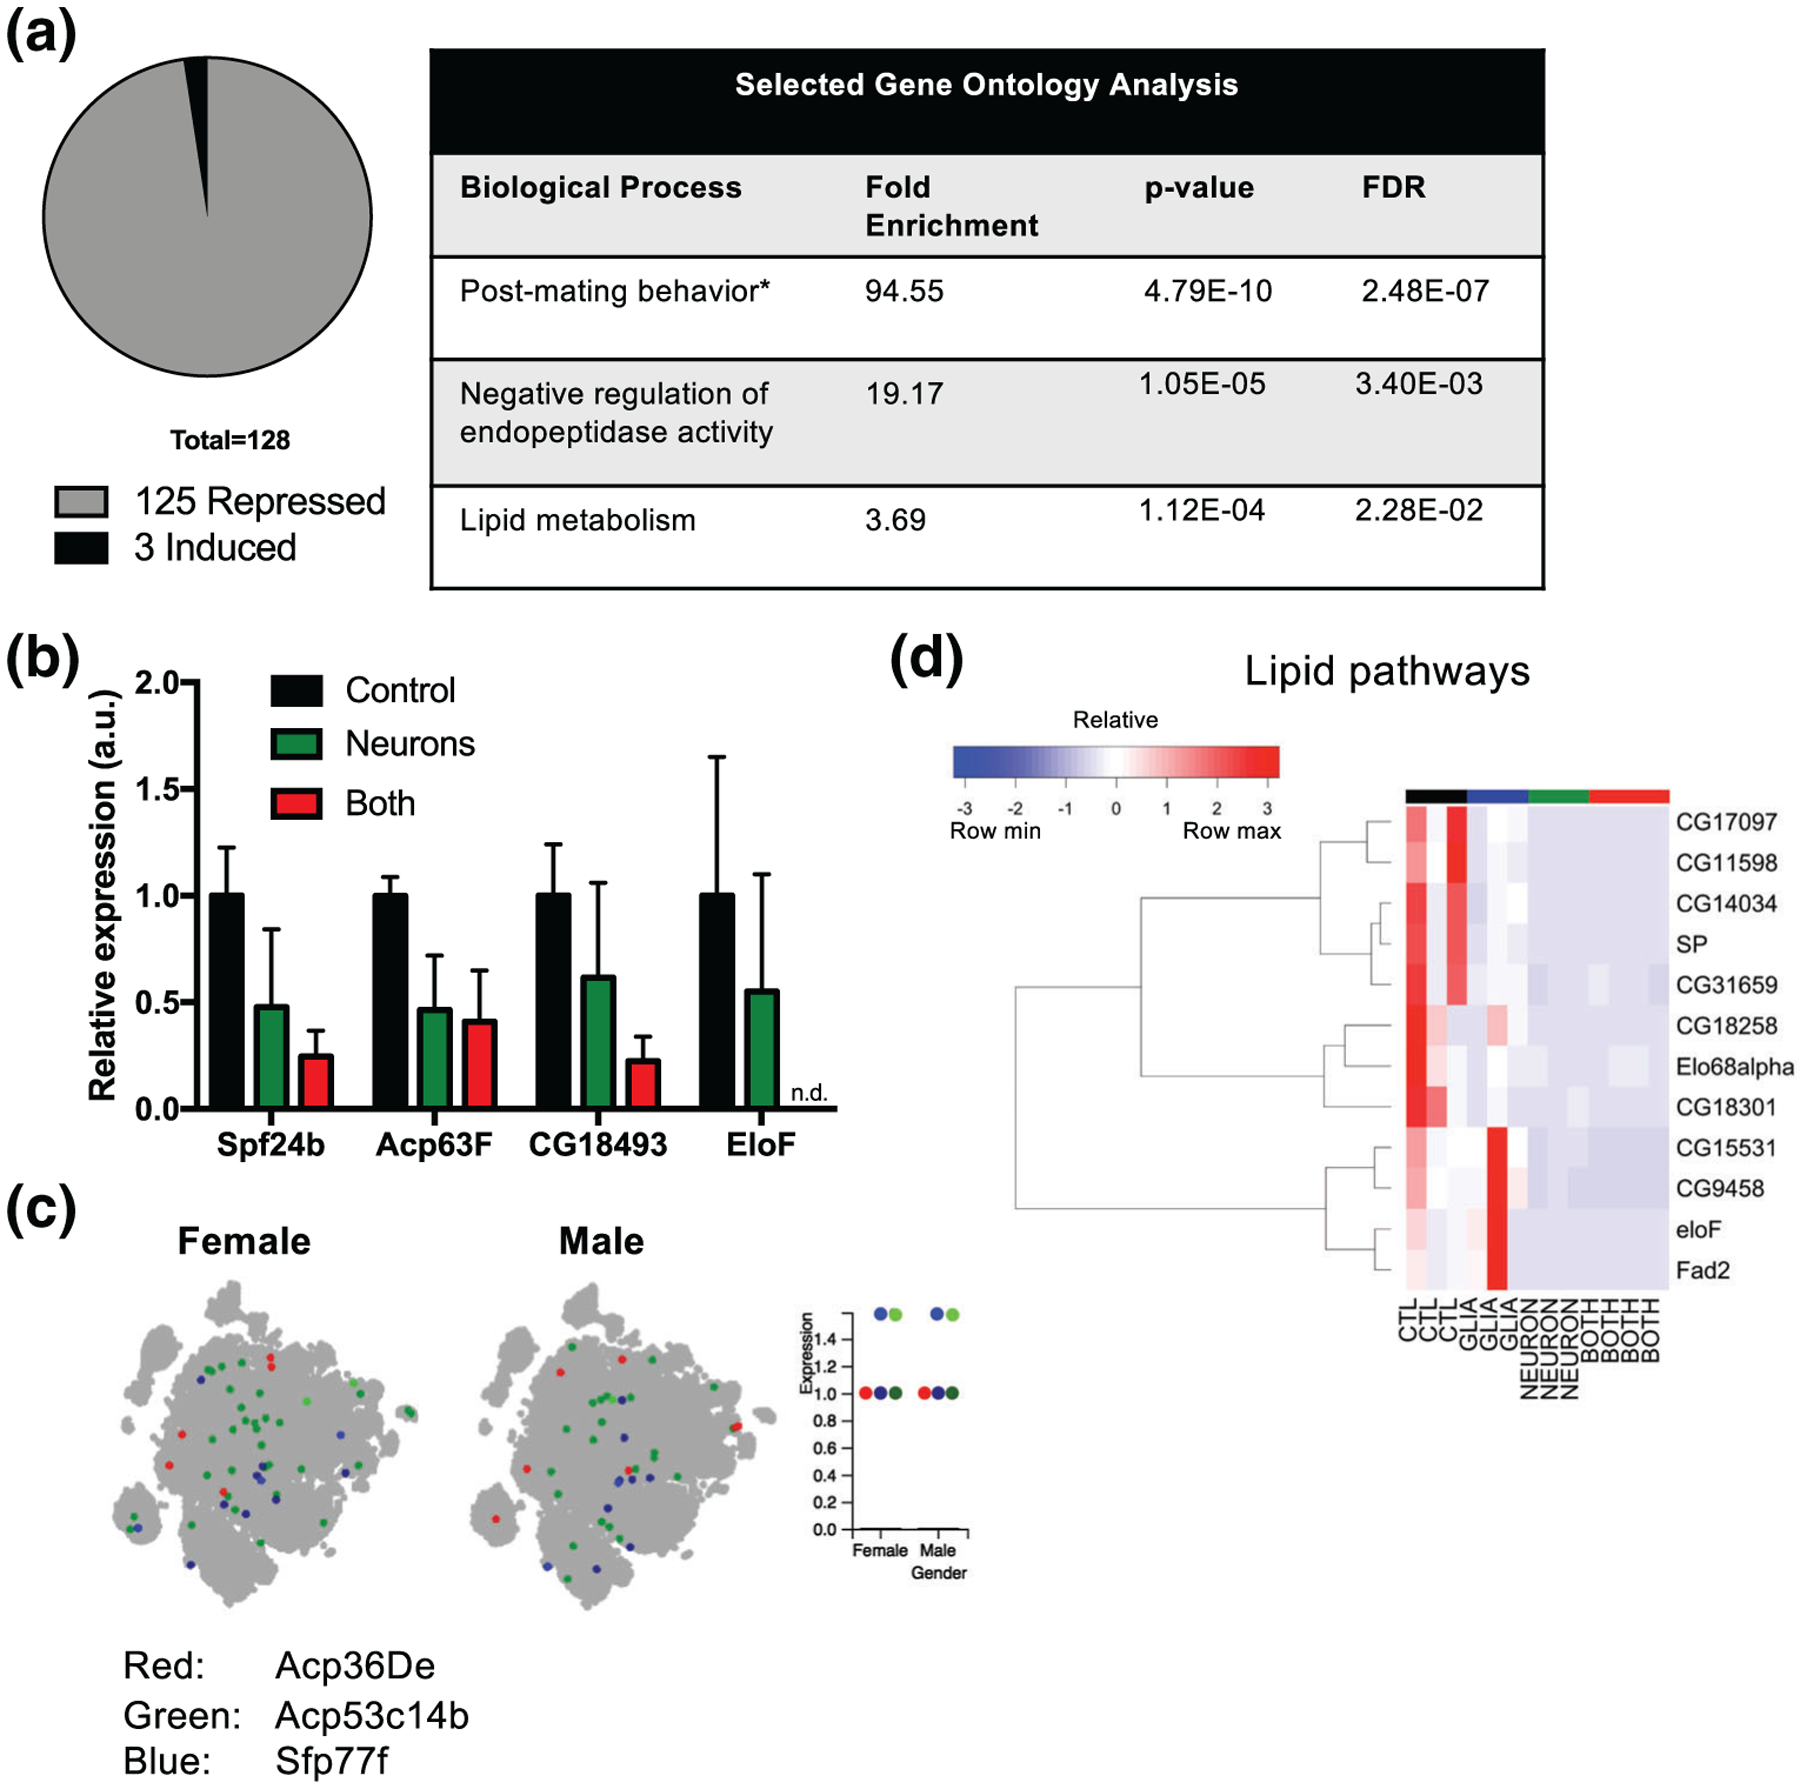
FIGURE 7.

Confirmation of transcriptional changes induced by neuronal α-synuclein. (a) Gene ontology analysis. *Other reproduction-related terms beyond “post-mating behavior” were also enriched (Data file S2). (b) qRT-PCR for male and lipid-related genes. Values in Neuron and Both are normalized to Control. n = 2–3 biological replicates. (c) Visualization of selected Acp and Sfp gene expression in single cell transcriptome atlas. The dot plot represents expression. For both Sfp77f and Acp53c14b, there is a high and low expressing population, indicated by dots that are the same color but different intensity. (d) Hierarchical clustering of lipid related genes. All genes were significantly differentially expressed with adjusted p-value < .05
