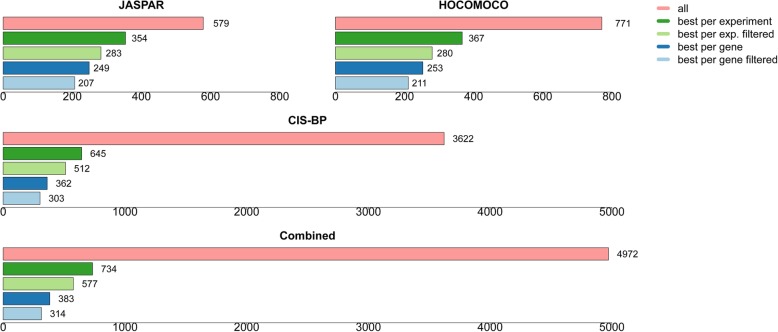
Fig. 7.
Statistics on the best performing TF motif matrices. “Best performance per gene” means globally best performance over all corresponding ChIP-seq, HT-SELEX (top 10%), and PBM experiments in terms of aggregate rank scores (see the “Methods” section) over all corresponding experiments. The qualifier “filtered” relates to the numbers obtained when we only considered experiments for which at least one matrix achieved a ROC AUC value > 0.75 (ChIP-seq, HT-SELEX) or a Pearson correlation coefficient > 0.35 (PBM). The first three bar plots show the numbers for individual motif collections analyzed separately, whereas the last plot at the bottom shows the numbers obtained when all three collections were considered simultaneously

