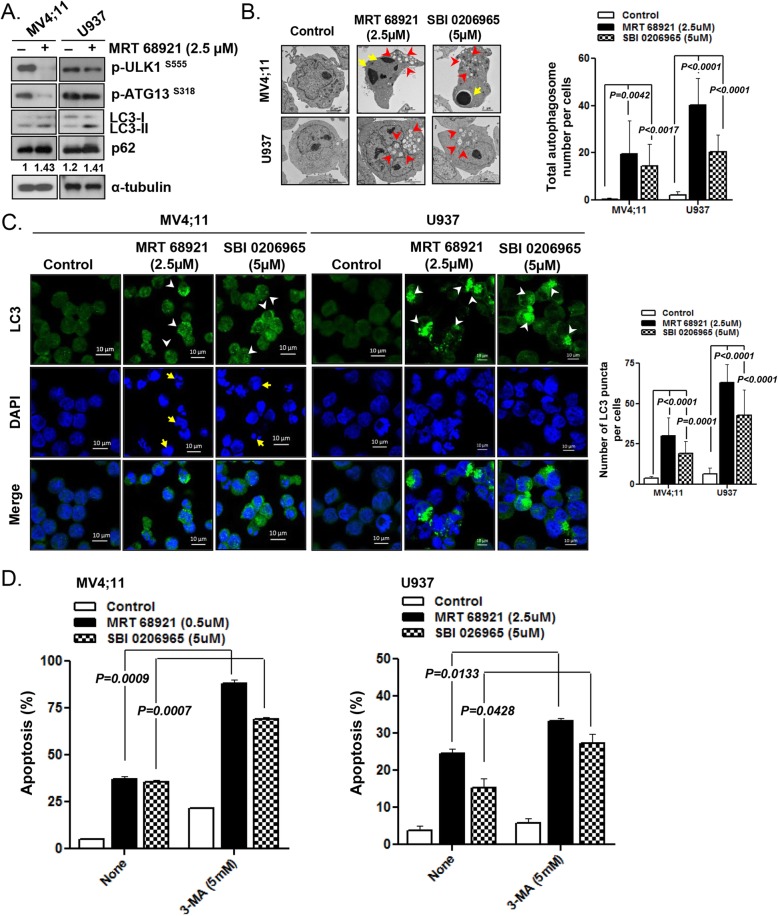
Fig. 4.
Autophagy induction by ULK1 inhibitors in AML cells. a After treatment of MV4;11 cells and U937 cells with 2.5 μM of MRT 68921 for 24 h, cell lysates were subjected to western blotting for p-ULK1, p-ATG13, LC3-I/II and p62. α-Tubulin was used as a loading control. All experiments were performed at least three times independently. b TEM-based ultrastructural examination of MV4;11 cells and U937 cells treated with ULK1 inhibitors (MRT 68921; 2.5 μM, SBI-0206965; 5 μM) for 24 h. The arrowheads and arrows indicate autophagosomes and condensed chromatin, respectively. Autophagosomes were counted in at least three different visual fields. Data are the mean ± SD. CTL, control. c MV4;11 and U937 cells were treated with ULK1 inhibitors (MRT 68921; 2.5 μM, SBI-0206965; 5 μM) for 24 h and fixed. Cells were stained for LC3B (green) and observed by confocal microscopy. Representative micrographs demonstrate the characteristic punctuate staining, which indicates autophagosome formation. Nuclei were stained with DAPI (blue). The arrowheads indicate LC3 puncta. The arrows denote condensed nuclei. LC3 puncta in each cell were counted in at least three different visual fields. Data are the mean ± SD. d MV4;11 and U937 cells were treated with ULK1 inhibitors (MRT 68921; MV4;11, 0.5 μM, U937, 2.5 μM, SBI-0206965; 5 μM) in the presence or absence of autophagy inhibitors 3-MA (5 mM). After incubation for 48 h, the apoptotic fraction was measured by flow cytometry based on Annexin-V/PI exclusion. Data are the mean ± SD

