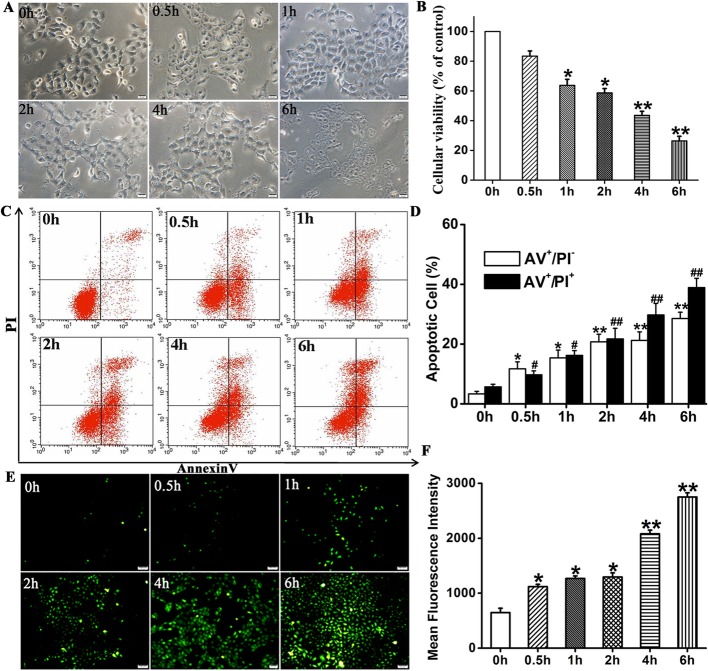
Fig. 2.
Effects of H2O2 on HaCaT according to CCK-8 assay and Annexin V-PI and ROS staining. a Morphological changes in HaCaT cells treated with 1 mM H2O2 at various times. b HaCaT cells treated with 1 mM H2O2 at different times followed by viability assay with CCK-8. Histogram shows H2O2 decreased HaCaT cell viability in a time-dependent manner. c Annexin V-PI staining combined with flow cytometry assay to detect apoptosis of HaCaT cells treated with 1 mM H2O2 at various times. d Histogram shows that apoptosis increased with induction time. e, f Analysis of intracellular reactive oxygen species (ROS) levels by DCF-DA assay. Histogram show that fluorescence intensity increased with induction time. Compared to 0h: *P < 0.05; #P < 0.05. Data are representative of three independent experiments (means ± SD)

