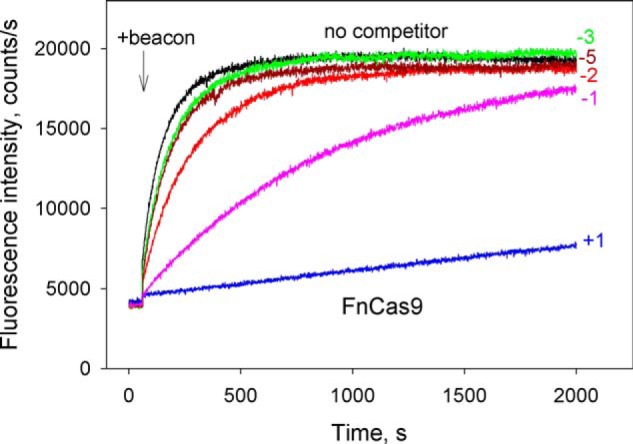
Figure 7.

Competition assay with FnCas9 using DNA probes with upstream edges at different positions. Shown are the effects of competitor DNA probes 4.1–4.6 (shown in Fig. 5A) on the kinetics of FnCas9–gRNA binding to beacon. Positions of upstream edges of the probes are indicated in the panels. The concentration of all competitors was 200 nm.
