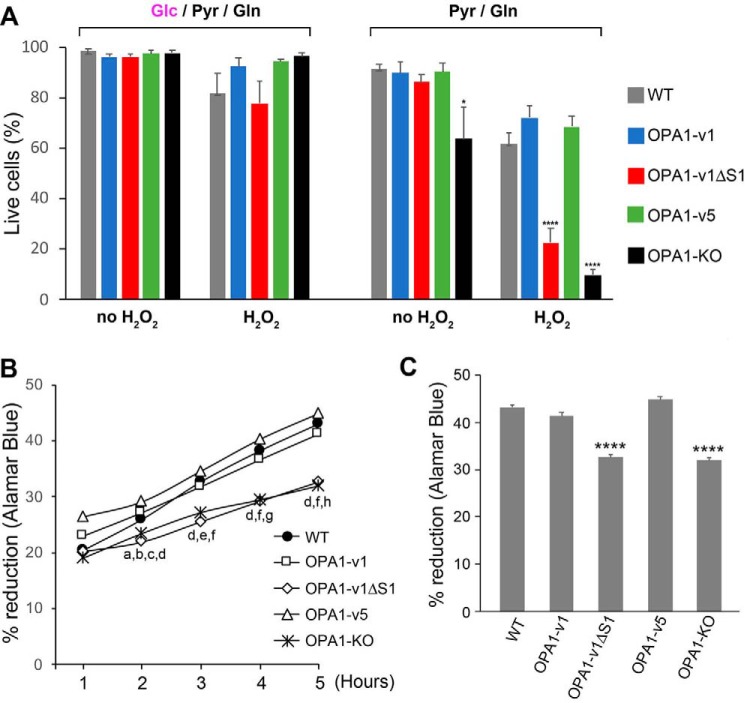
Figure 2.
Cells expressing L-OPA1 exclusively (OPA1-v1ΔS1) are more sensitive to oxidant insult. A, trypan blue assays of cells treated with 500 μm H2O2 for 18 h in glucose-containing and glucose-free conditions. OPA1-v1ΔS1 and OPA1-KO cells show a significant increase of cell death with H2O2 treatment in glucose-free OXPHOS conditions. n = 4 for glucose-containing; n = 6–9 for glucose-free; *, p < 0.05 versus WT and OPA1-v5 (one-way ANOVA, Turkey's multiple comparisons); ****, p < 0.0001 versus WT, OPA1-v1, and OPA1-v5 (one-way ANOVA, Turkey's multiple comparisons). Error bars, S.E. B, Alamar Blue was added after a 16-h incubation in OXPHOS media containing 500 μm H2O2, and the reduction of Alamar Blue was measured every hour for 5 h. n = 7. Comparisons within each time point are as follows. a, p = 0.001, WT versus OPA1-v1ΔS1; b, p = 0.0349, WT versus OPA1-KO; c, p = 0.0007, OPA1-v1 versus KO; d, p < 0.0001, OPA1-v1ΔS1 versus OPA1-v1 and -v5 and OPA1-v5 versus KO; e, p = 0.0004, OPA1-v1 versus KO; f, p < 0.0001, WT versus OPA1-v1ΔS1 and KO; g, p = 0.0003, OPA1-v1 versus KO; h, p < 0.0001, OPA1-v1 versus KO (two-way RM ANOVA, Turkey's multiple comparisons). C, 5-h accumulated reduction of Alamar Blue after 16-h incubation in OXPHOS media containing 500 μm H2O2. ****, p < 0.0001 versus WT, OPA1-v1, and OPA1-v5 (one-way ANOVA, Turkey's multiple comparisons).

