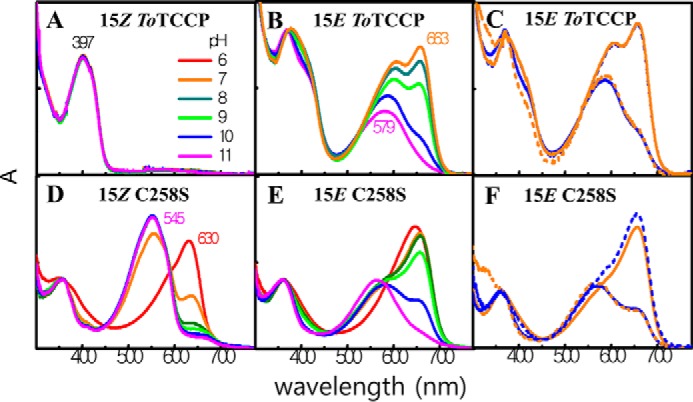
Figure 6.

Spectroscopic pH titrations of ToTCCP and its singly-linked C258S variant reveals pH-dependent equilibria between G- and R-absorbing species. ToTCCP WT and C258S variant in 15Z dark and 15E lit states at pH 8 were adjusted to different pH values (see “Experimental procedures” for details). All spectra are normalized to the same concentration in panels A, B, D, and E. In panels C and F, the 15E photoproduct at pH 7 and 10 (solid curves, blue pH 10, and orange pH 7) were adjusted to pH 7 or 10 (dashed curves, blue pH 7 and orange pH 10). Normalized spectra shown are superimposed.
