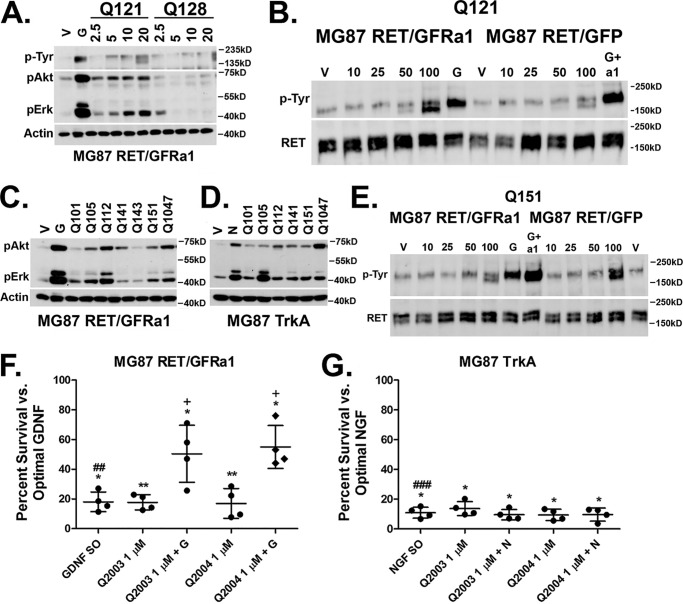
Figure 1.
Screening and structure–activity relationship of naphthoquinone RET activators. A, compound Q121 and Q128 activity in MG87 RET/GFRa1 cells. Following serum starvation, the cells were exposed for 20 min to vehicle, 10 ng/ml GDNF, or compounds at the indicated micromolar range. The lysates were collected and probed for pAkt, pErk, and total phosphotyrosine (4G10). Representative Western blotting data are shown. Actin was probed as internal loading standard. B, representative total RET immunoprecipitation from MG87 RET cells transfected with either GFRa1 or GFP control. Q121 treatment results in RET phosphorylation at concentrations of 50 and 100 μm in the cells expressing GFRa1. Total RET was probed as internal loading standard. For MG76 RET/GFRa1 cells, G represents GDNF as positive control. For MG87 RET/GFP, G+a1 represents GDNF+ GFRa1 co-treatment, which is needed to induce RET phosphorylation in these cells lacking GFRa. C, activities of naphthoquinone derivatives. Side-chain modifications generated compounds active in MG87 RET/GFRa1 as demonstrated by the representative Western blotting. D, the naphthoquinone derivatives are also active in MG87 TrkA cells as demonstrated by the representative Western blotting. E, compound Q151 induces RET phosphorylation in both MG87 RET/GFRa1 and in RET/GFP cells lacking GFRa1. F, MG87 RET/GFRa1 cells in SFM were treated with Q2003 and Q2004 alone or in combination with suboptimal GDNF (GDNF SO, 5 ng/ml). Survival was assessed by MTT after 72 h. Both compounds had low but significantly trophic activity at a concentration of 1 μm. Compounds significantly potentiate suboptimal GDNF. G, MG87 TrkA cells in SFM were treated with Q2003 and Q2004 alone or in combination with suboptimal NGF (NGF SO, 60 pg/ml). Survival was assessed by MTT after 72 h. Both compounds had low but significantly trophic activity at a concentration of 1 μm but did not potentiate suboptimal NGF. The data are expressed as percentages of survival ± S.D. from four experiments, with the respective optimal trophic factor (GF O, 30 ng/ml) standardized to 100% and vehicle to 0%. *, vehicle versus all treatments; #, suboptimal GF versus optimal GF; +, suboptimal GF versus all treatments. One symbol, p < 0.05; two symbols, p < 0.005; three symbols, p < 0.0005 (Bonferroni-corrected t test).

