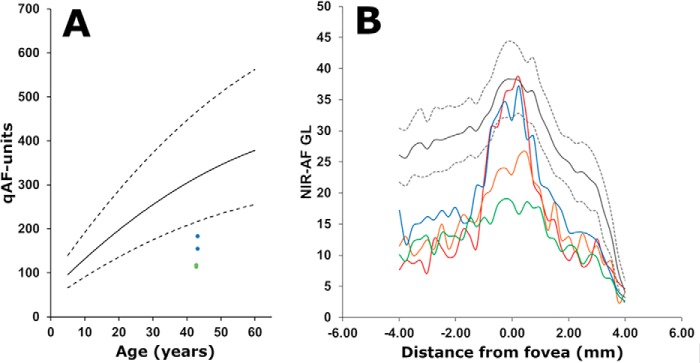
Figure 5.
Quantitation of fundus autofluorescence. A, short-wavelength (488 nm) fundus autofluorescence measured as qAF at an eccentricity of 7–9° and plotted as a function of age. Mean qAF8 of parents (blue, I-1; and green I-2) are plotted together with mean (solid black line) and 95% confidence levels (dashed lines) acquired from eyes of healthy subjects. Note that qAF intensities at the same location in the affected siblings were not measurable. B, semi-quantitative NIR-AF intensity profiles plotted as a function of temporal-to-nasal (left to right) distance (mm) along a horizontal line through the fovea (0). Gray lines represent mean (solid lines) and 95% confidence intervals (dashed lines) of healthy control eyes. Subjects are represented as follows: blue line, I-1; green line, I-2; red line, II-1; orange line, II-2.

