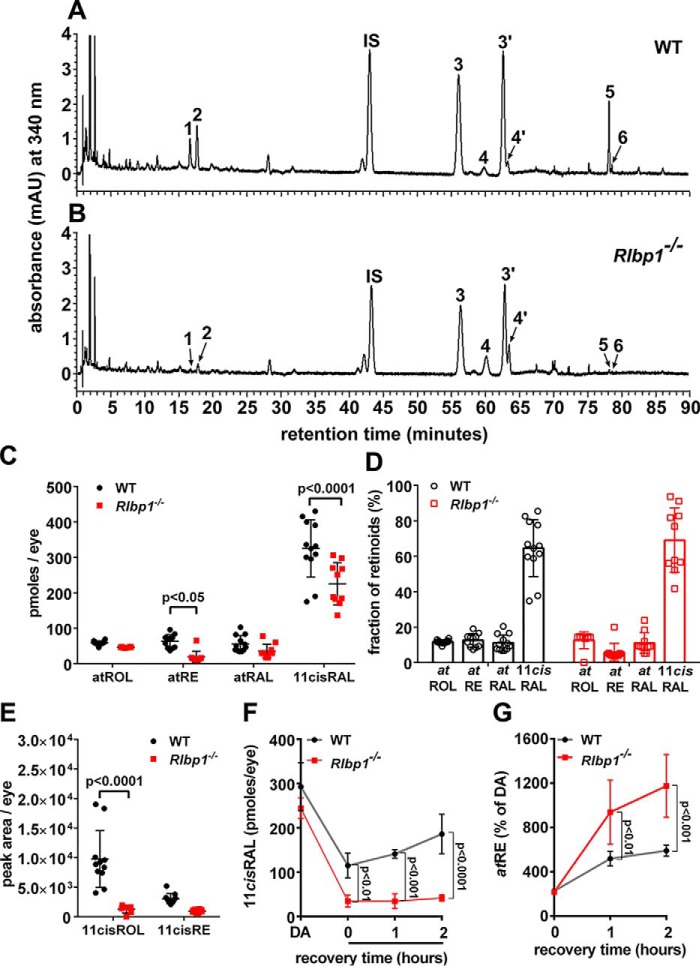
Figure 6.
Retinoid levels in dark-adapted agouti Cralbp−/− and WT mice. Ages were 2–4 months. A and B, representative UPLC chromatograms demonstrating separation of hexane-extracted retinoids in eyes of agouti WT (A) and Cralbp−/− mice (B). Monitoring was done at 340 nm. Age 4 months; 1 eye/sample. The numbers indicate the identity of peaks based on comparison with standards. 1, 11-cis-retinol; 2, all-trans-retinol; IS, internal standard, all-trans-retinyl acetate; 3, anti 11-cis-retinal-(O-ethyl) oxime; 4, anti all-trans-retinal-(O-ethyl) oxime; 3′, syn 11-cis-retinal-(O-ethyl) oxime; 4′, syn all-trans-retinal-(O-ethyl) oxime; 5, all-trans-retinyl palmitate; 6, 11-cis-retinyl palmitate. C and D, quantitation of retinoids as picomoles/eye (C). Presentation of data in C as percentage of total retinoid (D). All-trans-retinol (atROL), all-trans-retinyl palmitate (atRE), all-trans-retinal (atRAL), 11-cis-retinal (11cisRAL) are shown. E, quantitation of 11-cis-retinol (11cisROL) and 11-cis-retinyl palmitate (11cisRE) as peak area/eye. F and G, levels of 11-cis-retinal (F) and all-trans-retinyl ester (G) in dark-adapted (DA) mice recovering from a photobleach for 1 and 2 h in the dark. Mean ± S.D., 10–12 samples (C–E); 4 samples (F and G); p values determined by ANOVA and Sidak's multiple comparisons test.

