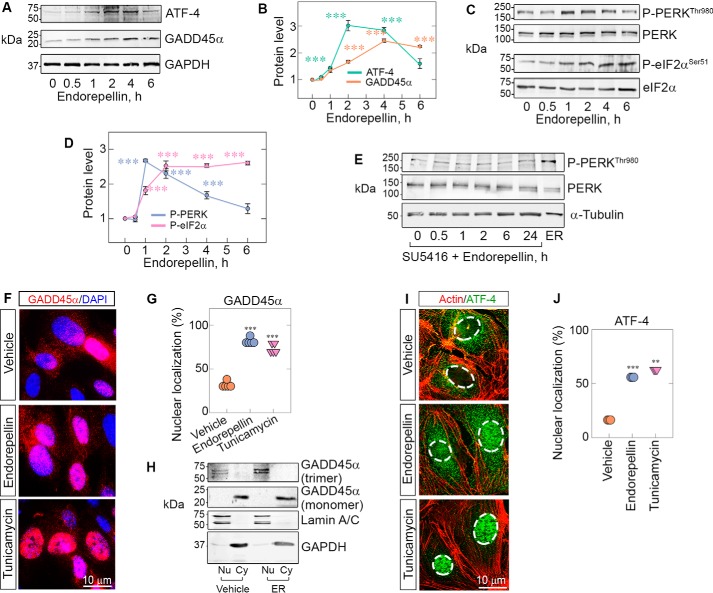
Figure 1.
Endorepellin evokes phosphorylation of PERK/eIF2α and up-regulation of ATF-4/GADD45α downstream of VEGFR2. A, representative immunoblots of time course experiments of HUVECs treated with endorepellin (200 nm, ranging from 0–6 h) and probed for ATF4 and GADD45α. Data were obtained from endorepellin-treated HUVECs from three independent experiments (n = 3) and normalized to GAPDH. B, quantification of ATF4 and GADD45α from A. C, representative immunoblots of time course experiments of HUVECs treated with endorepellin (200 nm, 0–6 h) and probed for p-PERKThr980, total PERK, p-eIF2αSer51, and total eIF2α. Data were acquired from three independent experiments (n = 3) and normalized to their respective total protein levels. D, quantification of p-PERKThr980 and p-eIF2αSer51 from C. One-way ANOVA was performed on all data. E, immunoblots of time course experiments of HUVECs pretreated for 30 min with SU5416 (a VEGR2 kinase inhibitor, 30 μm), followed by addition of endorepellin ranging from 0–24 h. The last lane shows the positive control, i.e. endorepellin alone for 2 h. α-Tubulin served as the loading control. F, immunofluorescence images of HUVECs showing cytoplasmic or nuclear distribution of GADD45α (red) seen with respect to DAPI (blue) after treatment with vehicle (PBS), endorepellin (200 nm), or tunicamycin (10 μg/ml) for 4 h. Nuclear localization of GADD45α is seen as a magenta hue under endorepellin or tunicamycin treatment conditions because of the merging of red and blue tones in the nucleus. G, quantification of cells with nuclear localization of GADD45α from F. An average of 100 cells per treatment (vehicle, endorepellin, or tunicamycin) were analyzed from five independent experiments. H, representative immunoblots of cell fractionation experiments of HUVECs treated for 3 h with or without endorepellin (200 nm). The membranes were probed for lamin A/C to label nuclear fractions (Nu), GAPDH to label cytoplasmic fractions (Cy), and GADD45α. Only the nuclear fraction was enriched in the trimeric form of GADD45α, and these levels were increased by exposure to endorepellin. I, immunofluorescence images of HUVECs treated with vehicle, endorepellin, or tunicamycin for 4 h and probed for filamentous actin (red) and ATF4 (green). The nuclei are outlined by dotted lines. J, quantification of cells with nuclear localization of ATF4 from I. An average of 500 cells per treatment (vehicle, endorepellin, or tunicamycin) were analyzed from three independent experiments (n = 3). All statistical analyses were calculated via one-way ANOVA (***, p < 0.001).

