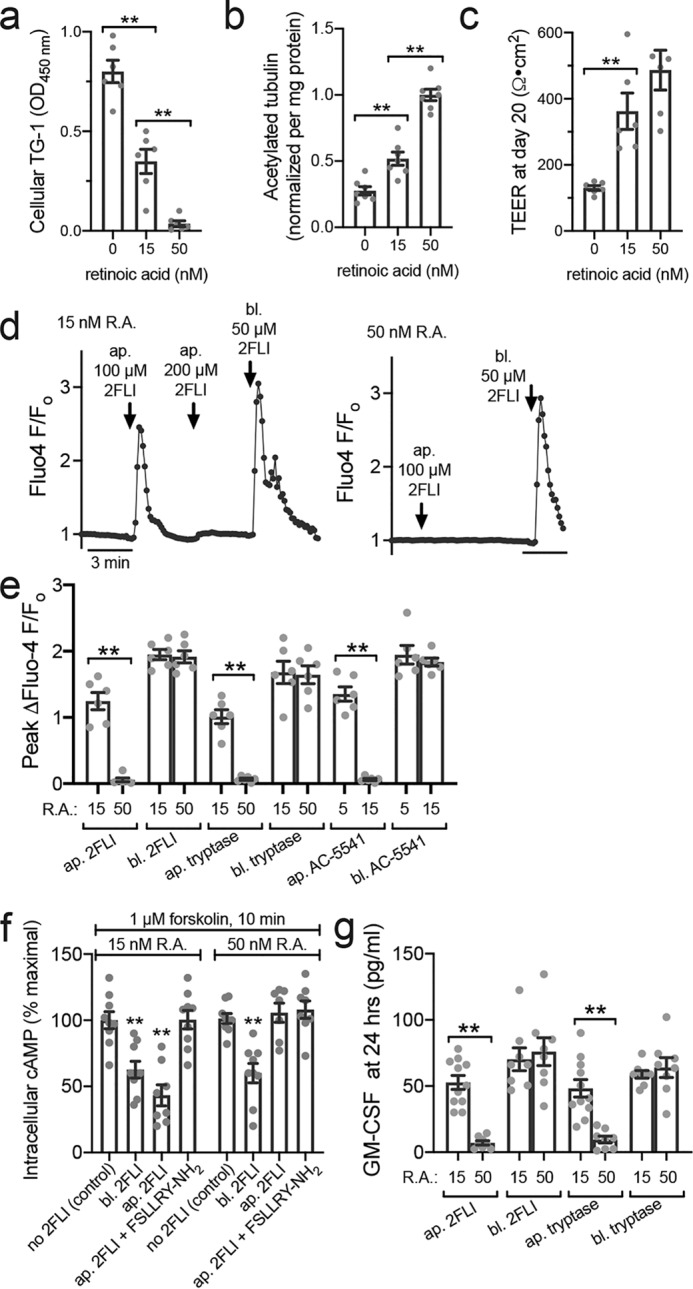
Figure 10.

R.A. deficiency also alters PAR-2 polarity. a, bar graph showing cellular TG-1 increase in primary human ALIs grown with reduced R.A. b, bar graph showing cellular acetylated tubulin reduction with decreased R.A. c, bar graph showing lower TEER measurements in the absence of R.A. No significant difference was observed between 15 and 50 nm R.A. d, representative Fluo-4 traces showing apical 2FLI response in low R.A. (15 nm) but not normal R.A. (50 nm) culture. Note in left trace that basolateral 2FLI increased calcium even after saturating apical 2FLI, supporting two pools of PAR-2 separated by the epithelial barrier. e, peak change in Fluo-4 F/Fo with apical (ap.) versus basolateral (bl.) 2FLI (50 μm), tryptase (10 μm), or PAR-2 agonist AC 55541 (10 μm) in cultures grown in 15 or 50 nm R.A. f, decreases in cAMP during apical versus basolateral PAR-2 stimulation (50 μm) were quantified by ELISA. As baseline cAMP levels were too low to quantify by this method, cultures were treated concomitantly with 1 μm adenylyl cyclase–activating compound forskolin ± 2FLI as indicated. Significance was determined by one-way ANOVA with Bonferroni post-test comparing all bars with control (no 2FLI) at either 15 or 50 nm R.A.; **, p < 0.01. g, GM-CSF was measured by ELISA after apical or basolateral stimulation with 2FLI (10 μm) or tryptase (20 nm). Note responses were observed to apical stimulation in e and f only in cultures with low R.A. All data points are independent experiments (6–10 per condition) using ALIs cultured from three to six patients (two ALIs per patient). Significance was determined by one-way ANOVA with Bonferroni post-test; **, p < 0.01.
