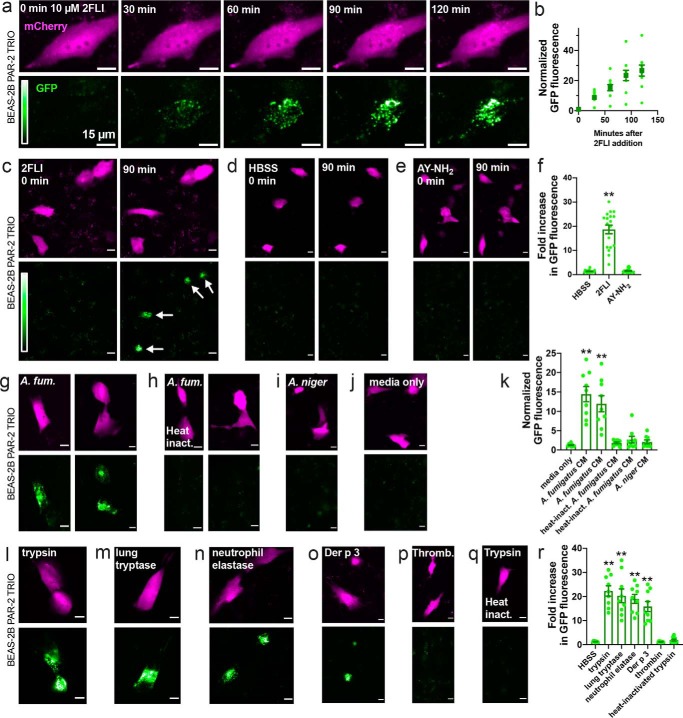
Figure 3.
A. fumigatus CM and immune cell proteases activate PAR-2 in BEAS-2B immortalized squamous bronchial epithelial cells. a and b, representative images (a) and quantification (b) showing time course of PAR-2–arrestin recruitment and the resulting increase in GFP fluorescence in BEAS-2B cells transfected with the PAR-2 Trio assay components and stimulated with PAR-2 agonist 2FLI (26). c–f, after 90 min stimulation, 2FLI (c) but not HBSS alone (d) or AY-NH2 (e) resulted in ∼20-fold increased GFP fluorescence, quantified in f. g–k, cells were stimulated for 10 min with 25% A. fumigatus (A. fum.) CM (g, strain 13073 left and 1022 right), heat-inactivated A. fumigatus CM (h; 20 min; 100 °C; strain 13073 left and 1022 right), A. niger CM (i), or media only (j) diluted in HBSS, followed by washing with HBSS and incubation for 90 min. GFP quantification is shown in k. l–r, cells were stimulated for 10 min with 25 nm trypsin (l), human lung tryptase (m), neutrophil elastase (n), Der p 3 (o), thrombin (p), or heat-inactivated trypsin (q), followed by washing with HBSS and incubation for 90 min. Quantification of GFP fluorescence is shown in r. Data points in b, f, k, and f are independent experiments performed on different days (n ≥ 5). Significance was determined by one-way ANOVA with Dunnett's post-test comparing all values to HBSS alone; **, p < 0.01. Scale bars are 15 μm.

