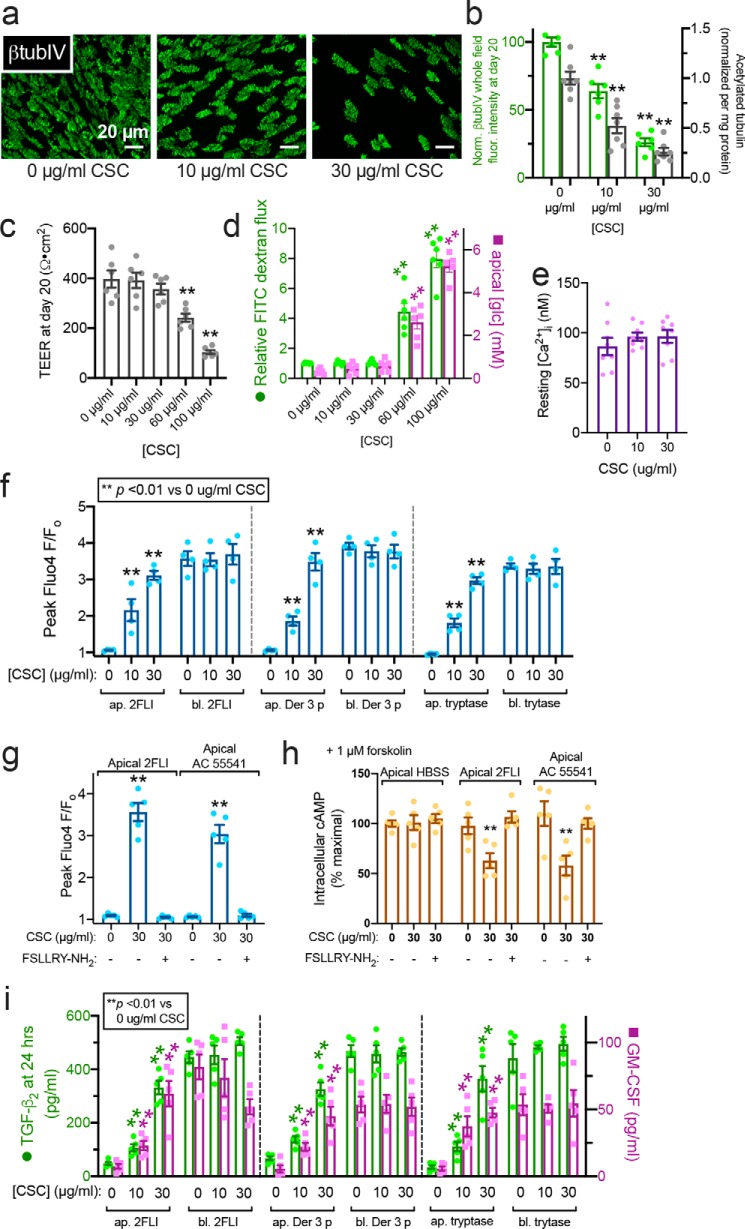
Figure 9.
Impaired ciliation by CSC exposure alters PAR-2 polarity. a, representative image showing reduction of cilia in ALIs exposed to CSC. b, quantification of β-tubulin IV immunofluorescence (green) and ELISA measurement of acetylated tubulin (gray). c, TEER from cultures exposed to CSC for 20 days of ALI differentiation; 30 μg/ml reduced cilia but maintained TEER. d, FITC–dextran permeability and apical glucose concentration with CSC, confirming barrier integrity at ≤30 μg/ml CSC. e, bar graph showing no statistically significant difference in resting intracellular calcium concentration [Ca2+]i in cultures treated with 0, 10, and 30 μg/ml CSC as in b–d. Significance was tested with one-way ANOVA with Bonferroni post-test. f, peak calcium responses to apical (ap.) and basolateral (bl.) 2FLI (25 μm), Der 3 p (1 μm), and tryptase (1 μm) in ALIs with 0, 10, or 30 μg/ml CSC. Note increase of apical 2FLI responses with increased CSC. g, bar graph showing apical responses to 2FLI or AC 55541 after CSC exposure were inhibited by PAR-2 antagonist FSLLRY-NH2. h, decreases in cAMP during apical PAR-2 stimulation (50 μm 2 FLI or 20 μm AC 55541 ± 100 μm PAR-2 antagonist FSLLRY-NH2 for 10 min) in ALIs treated with 0 or 30 μg/ml CSC as in b–g were quantified by ELISA. As baseline cAMP levels were too low to quantify by this method, cultures were treated concomitantly with 1 μm adenylyl cyclase–activating compound forskolin to elevate cAMP high enough for measurement. i, TGF-β2 and GM-CSF were measured by ELISA after 24 h apical or basolateral stimulation as in e. Note increased cytokine secretion with apical 2FLI in ALIs exposed to CSC. Significance was determined in b–g and i determined by one-way ANOVA with Bonferroni post-test comparing each value to its respective 0 CSC control; **, p < 0.01. Data points are from 6 to 10 individual ALIs from three to five human patients.

