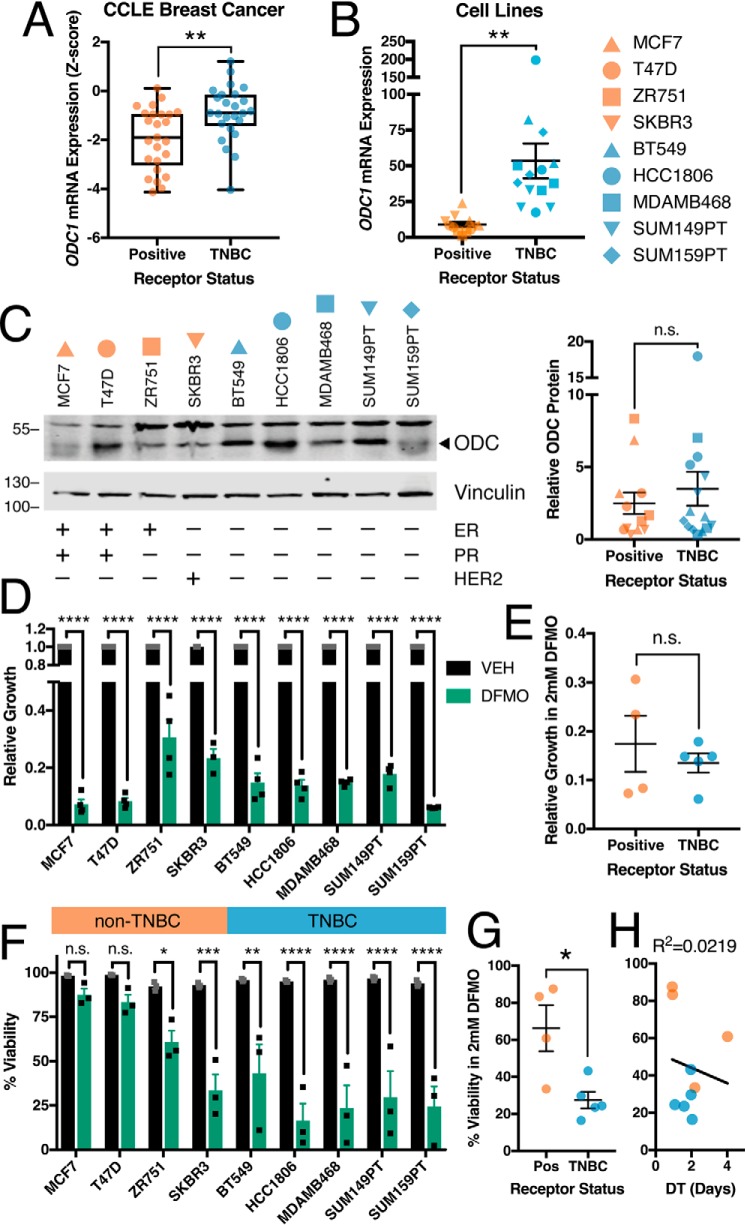
Figure 9.
Ornithine decarboxylase is a metabolic vulnerability in TNBC. A, comparison of ODC1 mRNA z-scores in 25 TNBC and 25 non-TNBC breast cancer cell lines (Cancer Cell Line Encyclopedia). B, comparison of ODC1 transcript levels measured by qRT-PCR. C, representative immunoblots and quantification (n = 3) of ODC protein in untreated breast cancer cell lines; band above 55 kD in ODC blots is nonspecific. D and E, growth of breast cancer cell lines measured as population size relative to vehicle after 72-h treatment with 2 mm DFMO. F and G, viability of breast cancer cell lines measured by propidium iodide uptake following 72-h treatment with 2 mm DFMO. H, doubling time of breast cancer cell lines compared with average viability from (F); R2 by linear regression. All error bars represent S.E. *, p < 0.05; **, p < 0.01; ***, p < 0.001; ****, p < 0.0001 by two-tailed unpaired t test (A–C, E, and G) or two-way ANOVA (D and F).

