Figure 2.
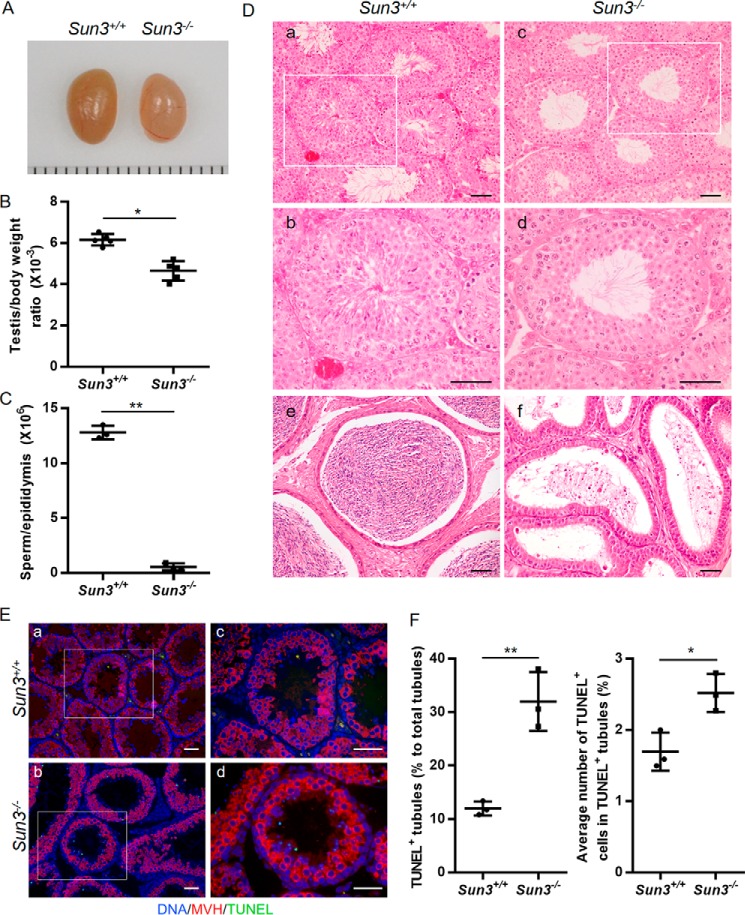
Deletion of Sun3 impairs spermatogenesis. A, representative images of testes from 8-week-old Sun3+/+ and Sun3−/− mice. Each grid represents 1 mm. B, average testes/body weight ratio of 8-week-old Sun3+/+and Sun3−/− mice (n = 5). C, epididymal sperm number of 8-week-old Sun3+/+ and Sun3−/− mice (n = 3). D, representative images of H&E-stained testicular sections (a–d) and epididymides (e and f) from 8-week-old Sun3+/+ and Sun3−/− mice. b and d, higher-magnification images of the rectangular area outlined with white boxes in a and c, respectively. Scale bars = 50 μm. E, TUNEL assay performed on testicular sections from 8-week-old Sun3+/+ and Sun3−/− mice. c and d, higher-magnification images of the rectangular area outlined with white boxes in a and b, respectively. Scale bars = 50 μm. F, percentage of TUNEL-positive tubules in testis sections from 8-week-old Sun3+/+and Sun3−/− mice (n = 3). F, quantification of TUNEL-positive cells per TUNEL-positive tubule. 298 tubules were examined from three Sun3+/+ mice. 375 tubules were examined from three Sun3−/− mice. Data are presented as mean ± S.D. Student's t test; *, p < 0.05; **, p < 0.01.

