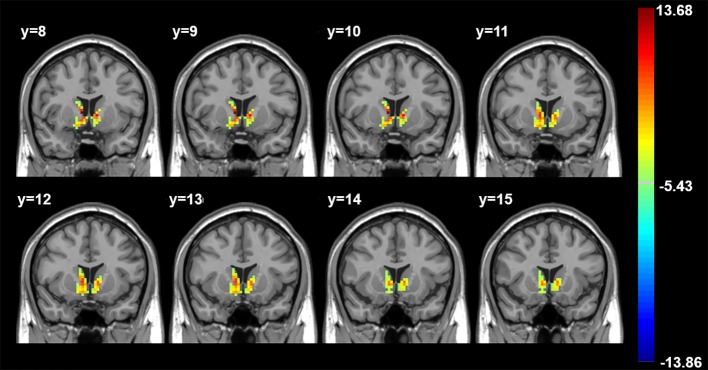
Figure 2.
Three-group differences, controlling for age, gender, and years of education. Color bar indicates F values. All findings p < 0.05 corrected for multiple comparisons using AlphaSim (p < 0.005, cluster > 49 voxels). R, Right. Axial images shown in radiological convention with MNI coordinates.

