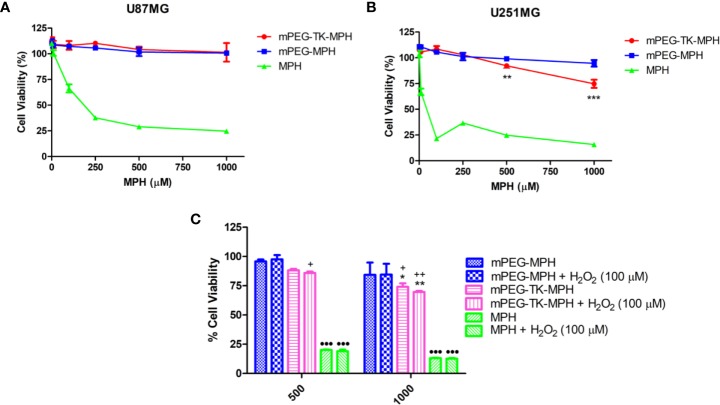
Figure 5.
Cytotoxicity studies on human GBM cells. (A) U87 MG cells treated with increasing concentration of either free MPH, mPEG-TK-MPH, or mPEG-MPH prodrugs at equivalent MPH concentrations for 48 h. (B) U251 MG cells treated with increasing concentration of either free MPH, mPEG-TK-MPH, or mPEG-MPH prodrugs at equivalent MPH concentrations, for 48 h. Statistics: Two-way ANOVA tests with Bonferroni post-test. Comparisons: mPEG-MPH vs. mPEG-TK-MPH (**p ≤ 0.01 and ***p ≤ 0.001). (C) Co-incubation of U251 MG cells treated with free MPH, mPEG-TK-MPH, or mPEG-MPH prodrugs, with H2O2 (100 µM). Statistics: Two-way ANOVA tests with Bonferroni post-Comparisons: mPEG-MPH vs. mPEG-TK-MPH and mPEG-TK-MPH + H2O2 (*p ≤ 0.05 and **p ≤ 0.01), mPEG-MPH + H2O2 vs. mPEG-TK-MPH and mPEG-TK-MPH + H2O2 (+p ≤ 0.05 and ++p ≤ 0.01), mPEG-MPH or mPEG-TK-MPH (w/and w/o H202) vs. MPH and MPH + H2O2 (•••p ≤ 0.001).

