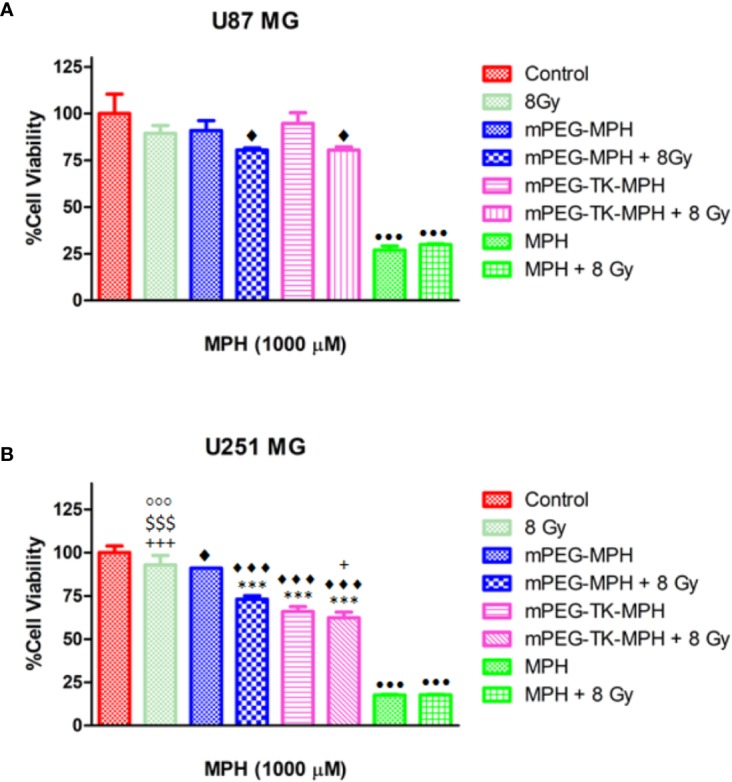
Figure 6.

Influence of X-ray irradiation on human GBM cells treated with mPEG-TK-MPH and mPEG-MPH. (A) U251 MG cells and (B) U87 MG cells. Statistics: One-way ANOVA tests with Bonferroni post-test. Comparisons: Control vs. mPEG-MPH, mPEG-MPH + 8 Gy, mPEG-TK-MPH and mPEG-TK-MPH + 8Gy (♦p ≤ 0.05 and ♦♦♦p ≤ 0.001); mPEG-MPH vs. mPEG-MPH + 8 Gy, mPEG-TK-MPH and mPEG-TK-MPH + 8 Gy (***p ≤ 0.001); mPEG-MPH + 8 Gy vs. 8 Gy, mPEG-TK-MPH and mPEG-TK-MPH + 8Gy (+p ≤ 0.05 and +++p ≤ 0.001), mPEG-TK-MPH vs. 8 Gy and mPEG-TK-MPH + 8 Gy ($$$p ≤ 0.001); 8Gy vs. mPEG-TK-MPH + 8Gy (◦◦◦p ≤ 0.001); MPH and MPH + 8 Gy vs. Control and all other treatments (•••p ≤ 0.001).
