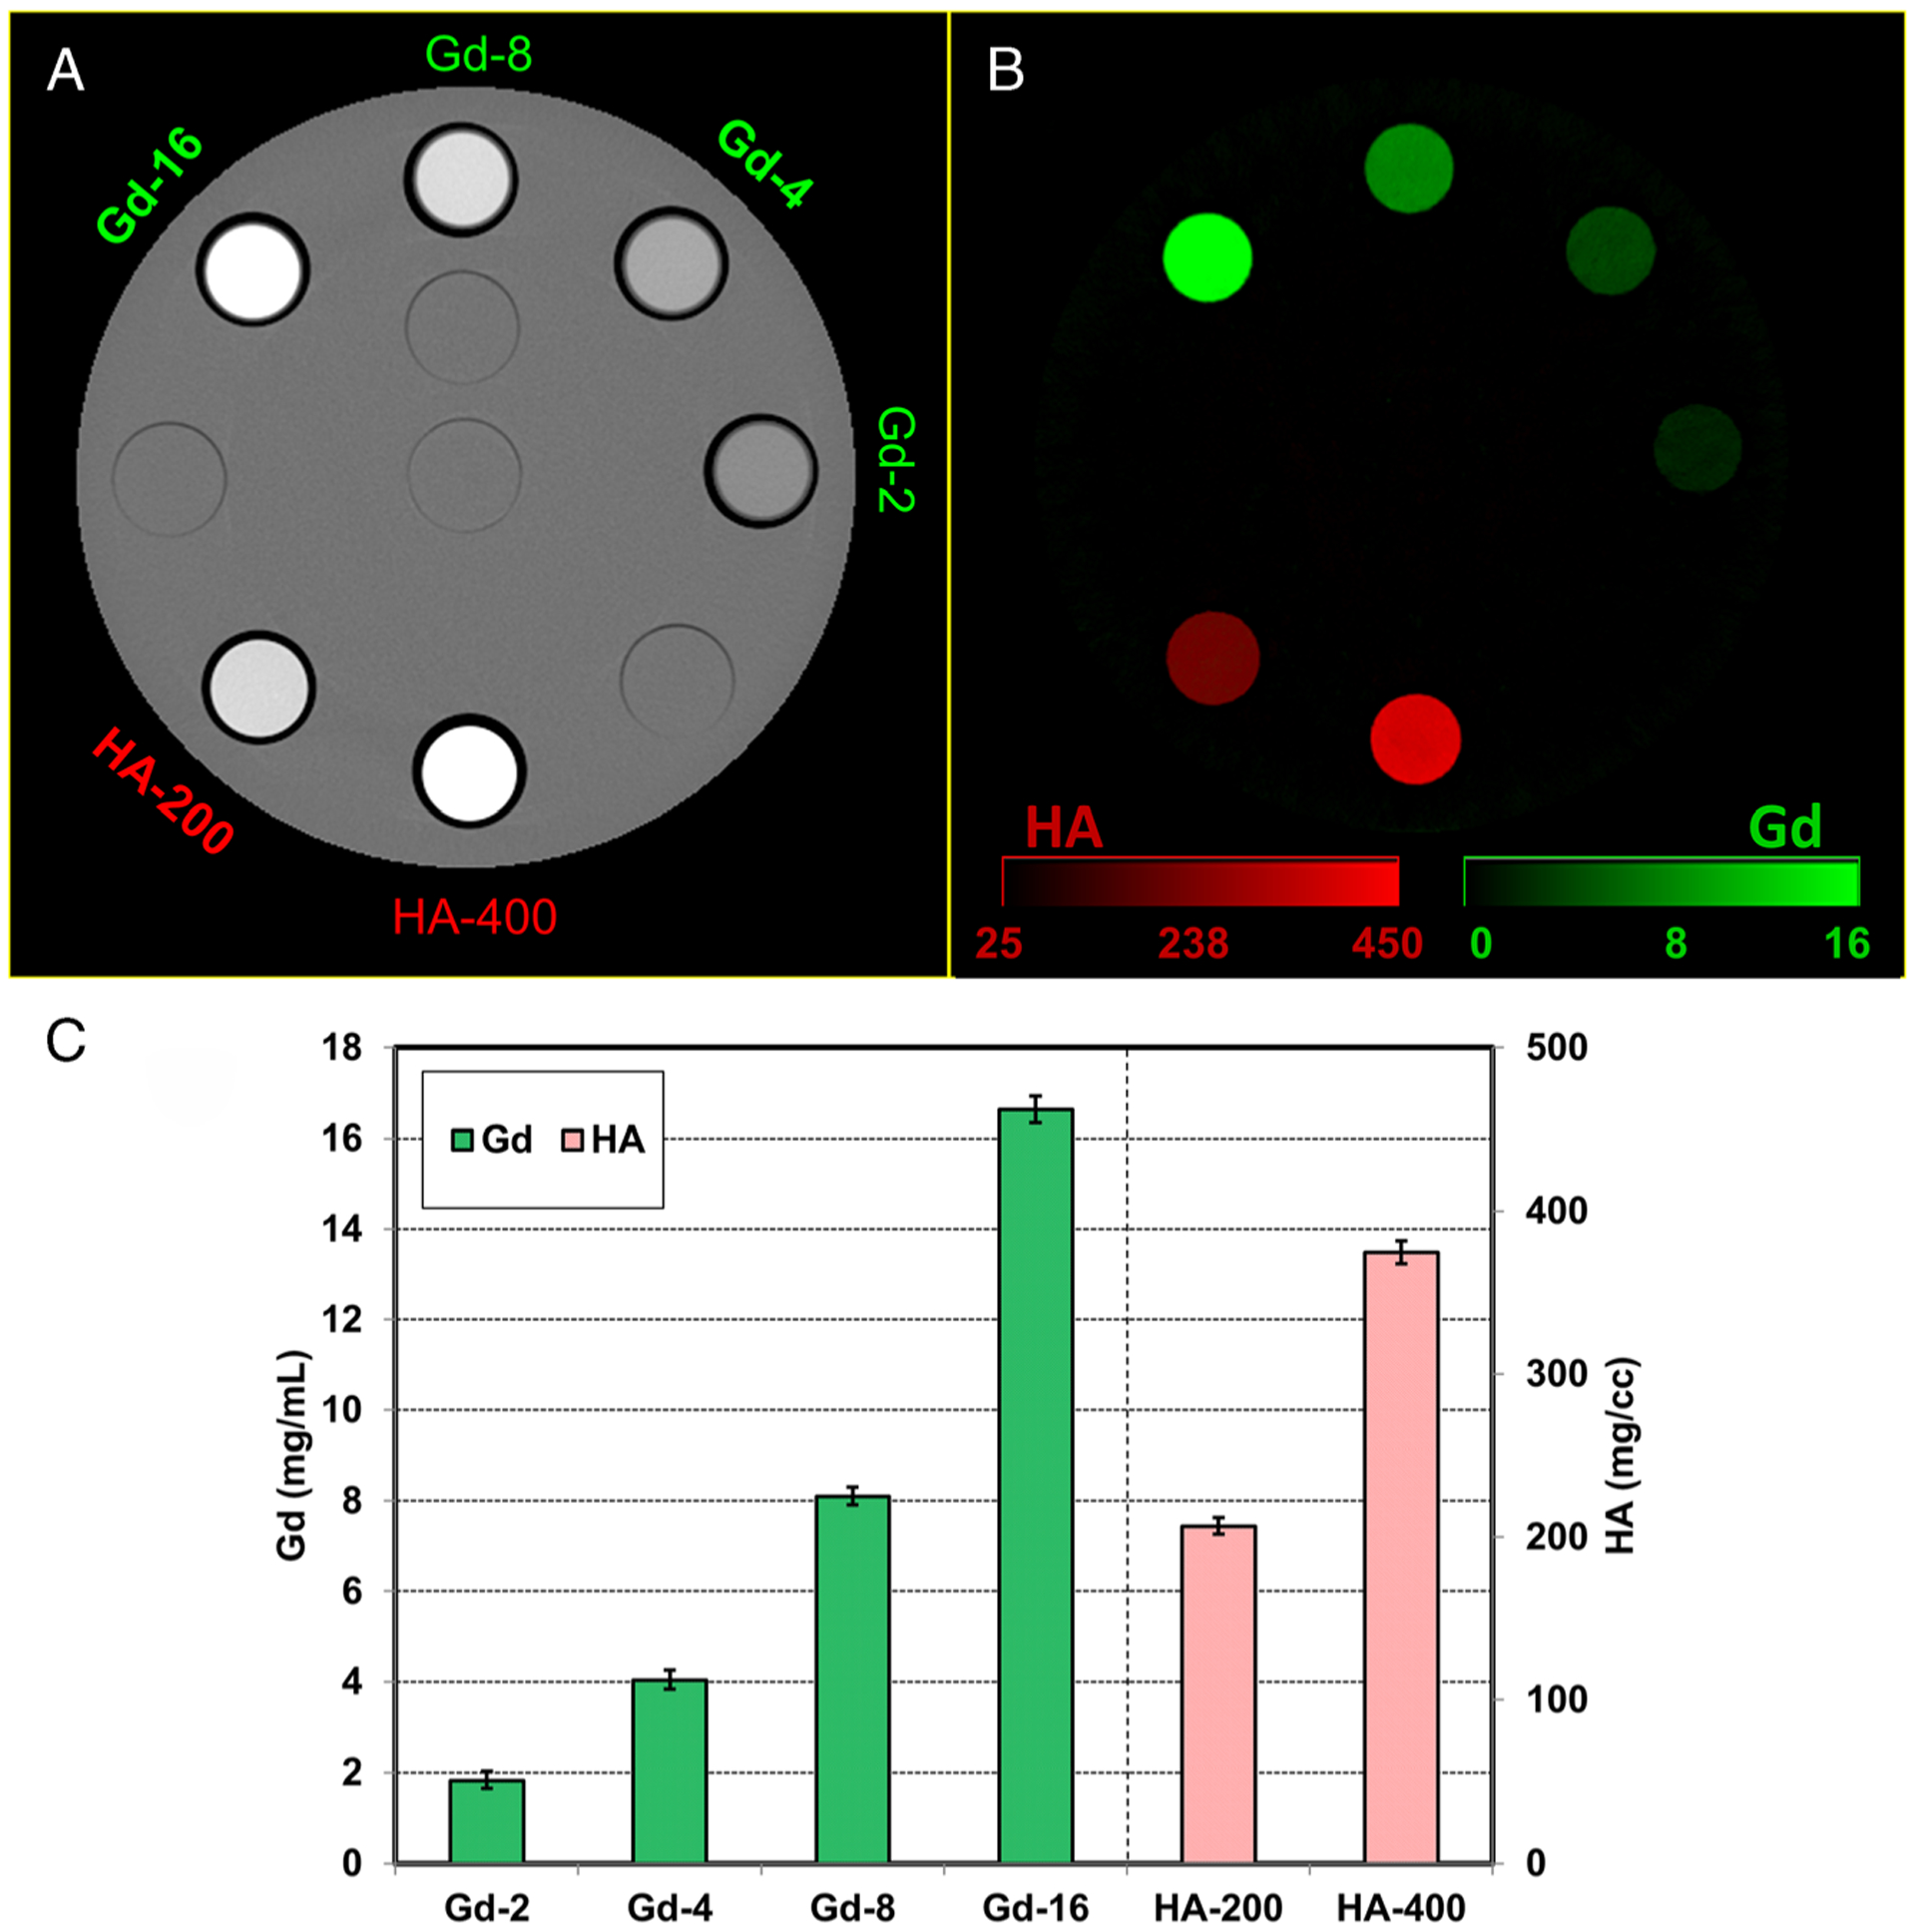
FIGURE 2.

Photon-counting detector computed tomography (PCD-CT) images from the multienergy phantom scan. A, PCD-CT (25–80) keV image with gadolinium (Gd 2, 4, 8, and 16 mg/mL) and hydroxyapatite (HA, 200 and 400 mg/cc) inserts. B, Material decomposition results showing delineation and quantification of Gd and HA inserts. C, Estimated mass densities compared with ground truth for Gd and HA (root-mean-squared error = 0.3 mg/mL and 18.4 mg/cc for Gd and HA, respectively). Horizontal axis entries represent material-concentration (eg, Gd-2 represents Gd at 2 mg/mL).
