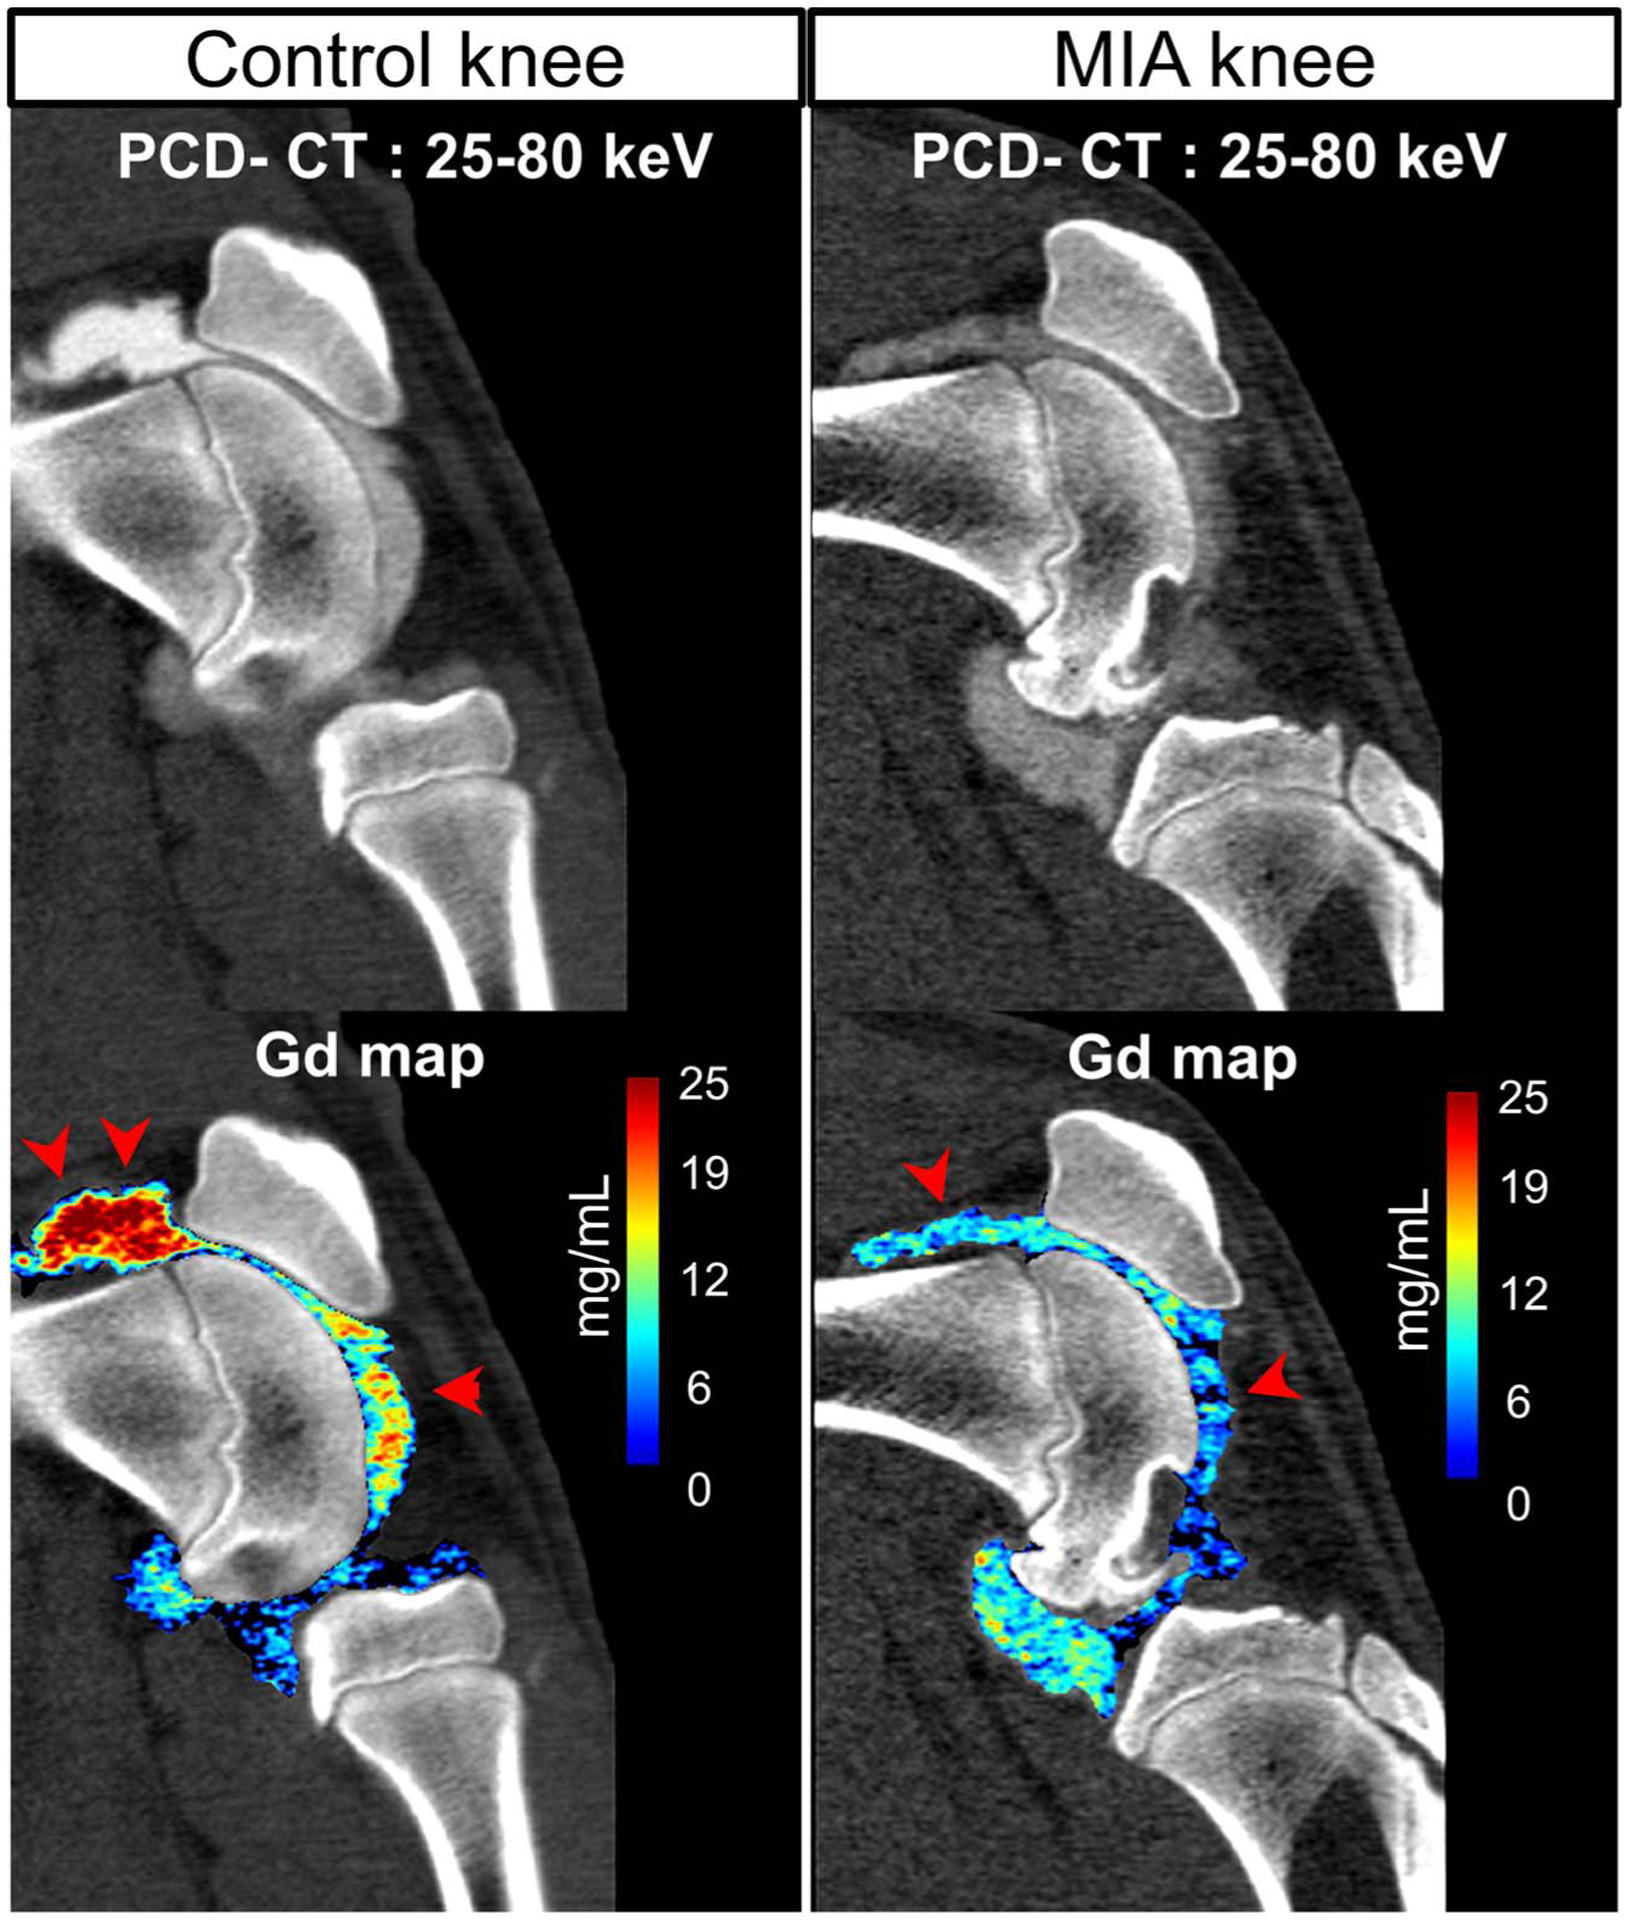
FIGURE 4.

Gadolinium maps from material decomposition applied to sagittal PCD-CT images from the same miniswine shown in Figure 3. The MIA knee showed decreased levels of Gd contrast (marked using arrow heads, displayed in units of mass density mg/mL) in the joint space compared with the contralateral control knee.
