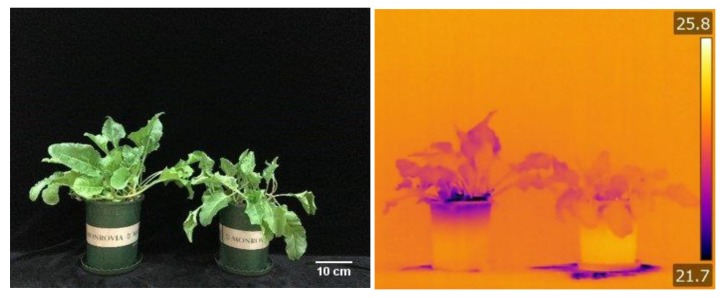
Figure 2.
Sugar beet grown for three weeks under control and 300 mM NaCl, normal imaging shows the effect of salinity stress on sugar beet growth (A) and thermal imaging indicates higher rates of transpirational cooling in plants under control conditions (B). One (of 5) typical images are shown for each panel.

